
Side-role for CO2: solar activity explains warming since 1976 & forms origin of 66-year cycle
January 5, 2020 - Author: Martijn van Mensvoort | ![]() Dutch version |
Dutch version | ![]() English version
English version
According the 2011 climate brochure of the Royal Dutch Academy of Sciences is the impact of the sun on climate not well understood1. On the Dutch KNMI website a 1997 lecture is presented which describes that the Gleissberg cycle of the sun is responsible for the warming up between the 1910s and 1940s2. The lecturer then describes that this multidecadal solar cycle is also the determining factor in the cooling-off period that follows, ending in 1970s. This downward impact of the sun is described being limited due to greenhouse gases. Finally, the warming period starting from 1980s is being attributed in the lecture to greenhouse gases.
However, researchers from the Max Planck Institute described in 2004 that the activity of the sun (based on the preceding 6 decades) reached a cumulative record level for the last 8,000 years3. Meanwhile from 1985 the minimum years of the 11-year solar cycle show a further increase in every cycle4. In 2017, according the LISIRD TSI, there is also a provisional "unofficial" new record in the sun's activity because of reaching a considerably higher level compared to all previous minima since the Maunder minimum in the 2nd half of the 17th century. Parallel to this, the 'Total Solar Irradiance' [TSI] will probably also reach a record in 2019, because for the first time since the Maunder minimum a consecutive period of 10 years in a row has arisen in which the sun produced a yearly average value higher than 1361.2 W/m2.
Combined with two other recent records in the 'Background Solar Irradiance' [BSI], this series of records shows a clear parallel with the global temperature record year 2016. Based on the 22-year magnetic solar cycle a curve is found in the BSI that completely fits into the annual variations of the HadCRUT4 temperature from the end of the 19th century. Via a reinforcing mechanism, the entire warming since 1976 can be explained on the basis of the activity of the sun.
For the period 1867-2017 a very high correlation is being described for the relationship between the temperature and the BSI: r = +0.98 [p=0.000]; this correlation is indicative for the causal relationship between the activity of the sun & the temperature development on earth. This correlation is also slightly stronger than the correlation between CO2 & the temperature: r = +0.97 [p=0.000]; the correlation between solar irradiance and CO2 is particularly high as well: r = +0.93 [p=0.000]. This results in a climate sensitivity maximum of ~0.49°C for the period since the start of the Maunder minimum near the year 1650.
Using the HadCRUT4 temperature series & PAGES 2k temperature proxies (2013) it is established that the rise in the activity of the sun and the temperature on earth both started in the 2nd half of the 17th century during the Maunder minimum - this period is known to have produced the lowest activity of the sun during the Little Ice Age. Since then, during three periods both the sun's activity and the temperature have shown a temporary decline. This happened during: (1) the Dalton minimum in the early 19th century; (2) the Modern minimum in the early 20th century; and (3) the most recent relapse occurred in the period 1965-1976.
The magnetic solar cycle is responsible for the development of a 'sawtooth movement' in the temperature on earth. Based on the solar minimum years a phase difference is found between the sun and the temperature, which has a considerable limiting effect on the correlation between the two. When the various phases in the 11-year solar cycle are studied separately, only the minimum years show a high correlation with temperature. This correlation is more than 4x stronger than for maximum years. After a phase correction for the TSI, the correlation becomes even stronger. A relatively large part of the 'climate noise' in the relationship between the sun and the temperature is likely caused by the maximum years in the solar cycle; the physical mechanism behind this phenomenon is also identified. It is being described as well that the sun is responsible for the creation of the 66-year cycle.
With the intention to make a comparison based on all phases of the solar cycle together, based on the sunspot cycle a 2nd correction is applied to the TSI which purposefully filters out a large part of the fluctuations; this results in the BSI. In the BSI, record levels have been reached in recent years that apply to both the entire current decade and the year 2015.
After the presentation of the technical summary (paragraph I), the research results (paragraphs II to VIII) and the discussion & conclusion (paragraph XI), an appendix is presented dedicated to the question: 'How does the solar cycle work?'. The appendix has a visual character, explaining how the sun works in relation to the sunspot cycle + its cosmic origin through the movement of the sun around the center of gravity of the solar system (see video 1). This cosmic dynamic is also the basis for the 66-year cycle, which is found in both the temperature development on Earth and the minimum years of the TSI. It also becomes clear that the 22-year-old magnetic solar cycle is a phase ahead of the 11-year solar cycle; the complex interaction between the two is also described (see video 2).
TIP: Figure 1 describes the basics of the analysis & figure 16 describes the result. Video 1 in the appendix serves as an illustration
for the formation of the multidecade cycle in the perspective of the cosmos.
SUMMARY:
More than 300 years ago, the coldest period of the Little Ice Age was reached during the Maunder minimum, which is known to form the lowest point in the sun's activity. Subsequently the activity of the sun has increased and the temperature of the earth's lower atmosphere has also started rising. In parallel with the global temperature record of 2016, various solar irradiance records are observed as well during the present decade. This study describes a very high correlation for solar irradiance and temperature: +0.98 [p=0.000] for the period 1867-2017 (see figure 16). This correlation is found on the basis of the 22-year-old magnetic solar cycle. A major difference is described for the impact of minima and maxima in the 11-year solar cycle; it becomes manifests via: temperature + the underlying physical mechanism.
A reinforcing mechanism is used to fully explain the global warming since 1850, including the warming since 1976. The correlation between CO2 and temperature has a similarly high magnitude: +0.97 [p=0.000]. The correlation between solar irradiance and CO2 is also particularly high with a magnitude of +0.93 [p=0.000]. These correlations point out that the temperature rise since the Maunder minimum is indicative for a high 'solar sensitivity' to small fluctuations of the sun, combined with a low 'climate sensitivity' (maximum ~ 0.49°C) to the relatively large increase of CO2.
CONTENTS
• I - Technical summary [ABSTRACT]
• II - Minimum years in solar irradiance cycle correlate 4x higher with temperature than maximum years
• III - After phase correction solar minima show an even stronger relationship with temperature
• IV - Sun shows a strong relationship with average temperature during a magnetic solar cycles
• V - Magnetic solar cycle provides additional evidence for a reinforcing mechanism
• VI - Sun is responsible for the 66-year cycle + part of the upward trend channel
• VII - 'Solar sensitivity' is high & 'climate sensitivity' is low
• VIII - Climate definition is outdated
• IX - Discussion & conclusion
APPENDIX: 'How does the solar cycle work?'
(Data: Excel file)
I - Technical summary [ABSTRACT]
{I-1} The scientific literature describes since at least 2003 that in addition to a falling trend in the peak values of the 11-year sunspot cycle in recent decades, a strikingly opposite phenomenon manifests in the minimum years of the 'Total Solar Irradiance' [TSI]4. On the basis of the HadCRUT4 temperature series and the LISIRD TSI is demonstrated for the period since 1910 that a significantly higher correlation is found between minima (r = +0.803; p <0.01) of the TSI and temperature, compared to maxima (r = +0.183; p=N.S.); the physical mechanism behind this difference is also described. Combined with the 22-year-old magnetic solar cycle this observation forms the basis for the most important result persented at the end of the analysis: the description of a very high correlation between solar activity & temperature development on earth for the period 1867-2017 (r = +0.98; p=0.000). This correlation can only find it's origins at the sun. Moreover, the correlation is slightly stronger than the correlation between CO2 & the temperature (r = +0.974; p=0.000). The correlation between solar activity and CO2 is also particularly high (r = +0.93; p=0.000). According simple logics, the sun is very likely at the origin of this remarkably strong pattern. In the various natural cycles within the climate system on Earth, CO2 always follows the temperature via the vegetation system and/or the ocean system. The correlations found in this study point for the temperature rise since the Maunder minimum towards a high 'solar sensitivity' with regard to relatively small fluctuations of the sun, combined with a low 'climate sensitivity' (maximum ~0.49°C) for the relatively large increase of CO2.
{I-2} In the perspective of solar minimum years, three other striking phenomena are found in both the TSI and the temperature: (1) a regular multidecadal cycle with a duration of 6 solar cycles that are accompanied with a remarkably high amplitude; (2) an upwardly directed trend channel on which the multidecadal cycle manifests; (3) a 'saw-tooth movement' featured with temperature rises (or falls) when TSI falls (or rises). This 'sawtooth movement' is caused by the magnetic cycle of the sun, which is known to be accompanied with a succession of high & low peaks, and/or pointed & wide peaks.
{I-3} After a phase correction that is putting the TSI one cycle back in time, a highly significant correlation is found between the TSI and the temperature for the lowest minimum years (r = +0.904; p=0.000). The mechanism behind the phase difference can be understood on the basis that the 22-year-old magnetic solar cycle is fundamentally the determining factor and is several years ahead of the 11-year solar cycle. In addition, both cycles are in an opposite phase, with the poloidal magnetic cycle moving through the zero phase when the sunspot cycle moves through the phase of the maximum years. Combined with the large difference between the minimum and maximum years, a total picture emerges which suggests that 'climate noise' especially arises during the maxima of the solar cycle under the influence of the sunspot cycle. With the intention of minimizing/reducing the influence of 'climate noise' related to especially the maximum years, an analysis is subsequently made based on the 'Background Solar Irradiance' [BSI = TSI minus sunspots], whereby the fluctuations due to the sunspot cycle are largely removed from the TSI. In the perspective of the minimum years this correction also contributes to a further increase in the correlation between solar activity and temperature (r = +0.924; p=0.000); this correlation is also higher than the correlation between CO2 and temperature.
{I-4} In order to reduce both the influence of the 'sawtooth movement' (resulting from the magnetic solar cycle) and other 'climate noise' (resulting from especially solar maximum years), an analysis is then carried out based on the average value of the TSI, BSI and the temperature for all magnetic solar cycles that start and end at a minimum year in the 11-year solar cycle. Curves are found with an oscillating movement that show a high degree of similarity among all three factors. After the aforementioned phase correction, mutual correlations are found with a very high significance level. The correlation between the BSI and the temperature for the period 1856-2008 is here even higher (r = +0.928; p=0.000). Including the phase correction, the BSI curve based on average values during magnetic cycles completely fits into the bandwidth of the annual fluctuations within the HadCRUT4 temperature series since the year 1880. Without the phase correction, this BSI curve falls bellow the bottom of the HadCRUT4 temperature series from the end of the 1970s; however, the magnitude of the difference decreases during the 21st century. Both from the perspective of the TSI based on minimum years, and also for the BSI based on average values during one magnetic cycle, the temperature rise since 1976 can be explained fully by means of solar activity change.
{I-5} Numerically, on the basis of the TSI minimum years (up to and including 2017 and after a phase correction of one solar cycle) about 75% to 95% of the temperature rise since 1976 can be attributed to the combination of: the 66-year cycle + an acceleration in the upward trend in solar activity. This is a first indication which suggests that 'climate sensitivity' is probably low, because after applying the aforementioned correction high correlations are found that leave approximately less than one quarter for other influences. Which suggests that in the perspective of climate change the cumulative influence of the sun over a period of several magnetic solar cycles is likely to represent a significant factor as well.
{I-6} Using the PAGES 2k temperature proxies (2013), it is established that the upward trend in most of the 19th century (1810-1902) was probably in the order of +0.0316°C per decade by average. Interestingly, the HadCRUT4 shows a considerably lower trend between 1872-1939: +0.015°C per decade. Based on a comparison between the course of the PAGES 2k proxies, the HadCRUT4 and the GISSTEMP v4, an indication is found which shows that the first peak phase of the 66-year-old in the HadCRUT4 series is the largest outlier found in all three perspectives together. From this can be deduced that the impact of the temperature increase between the 1870s and the 1940s is featured with a relatively small difference between the years 1978 and 1944 (mainly due to high outliers in the years 1877 and 1878) in the HadCRUT4 series, which induces an underestimation of the difference between the 1870s and the 1940s. This contributes to the side-effect involving an overestimation of the rate of temperature rise for the period since the late 1970s.
{I-7} Two strong indications are described pointing towards a consistent reinforcing mechanism for relatively small fluctuations in solar activity. In years when the solar magnetic north pole starts it's polarity change, the ENSO cycle on earth always shows a negative average value. The impact of this phenomenon is so strong that La Nina conditions are usually encountered in those years, which are usually accompanied with cooling relative to the preceding year. Also briefly discussed is a phenomenon which shows that the periods of cooling in the 20th century manifested in years during when both the TSI and the angular momentum (involging the movement of the sun around the barycenter) are near it's bottom phase.
{I-8} Finally, a clear parallel is described between the global temperature record of 2016 and four recent records involing solar activity. In the perspective of the TSI minimum years, a significantly higher record level is reached in 2017 combined with a period of 10 years in a row that is established in 2019 with all yearly TSI average values above 1361.20 W/m2. Since the start of the global instrumental temperature series in the year 1850, before the 2010s it happened only twice that a period of 7 years in a row has been found with all higher values - the 2nd period of these involves the first decade of the 21st century. This also clearly shows that during the first two decades of the 21st century, solar activity has been exceptionally high. The BSI shows a firm new decadal record for the 2010s; also, a new annual record level was reached in 2015 - directly prior to the global temperature record year 2016.
II - Minimum years in solar irradiance cycle correlate 4x higher with temperature than maximum years
{II-1} In figure 1 the total solar irradiance (= TSI according the LASP Interactive Solar Irradiance Datacenter, presented by the 'Laboratory for Atmospheric & Space Physics' of the University of Colorado) is plotted against the HadCRUT4 temperature series. In both graphs the 3 lowest minimum years and the 3 highest maximum years are marked based according the TSI cycle. Figure 1 also shows the correlation for years in the same phase of the solar cycle; these correlations demonstrate a big difference between the minimum and maximum years. The 1910-2019 period shows a weak correlation (r = +0.306; p=N.S.) between the TSI and the HadCRUT4. However, for the 3 lowest minima together, a much higher correlation is found combined with a high level of significance (r = +0.768; p<0.001); in contrast, the correlation is much weaker for the combined maxima (r = +0.285; p=N.S.) although for the individual phases involved the correlations are always positive.
{II-2} Striking is that in the individual solar phases the weakest correlation is found at the highest solar maxima; the strongest correlations are found at the two lowest solar minima. The correlation involving the lowest minimum years (r = +0.804; p<0.01) is more than 4x higher than the correlation involving the highest maximum years (r = +0.184; p=N.S.).
(All images have a high resolution version: 'click' on the images for more details if desired)
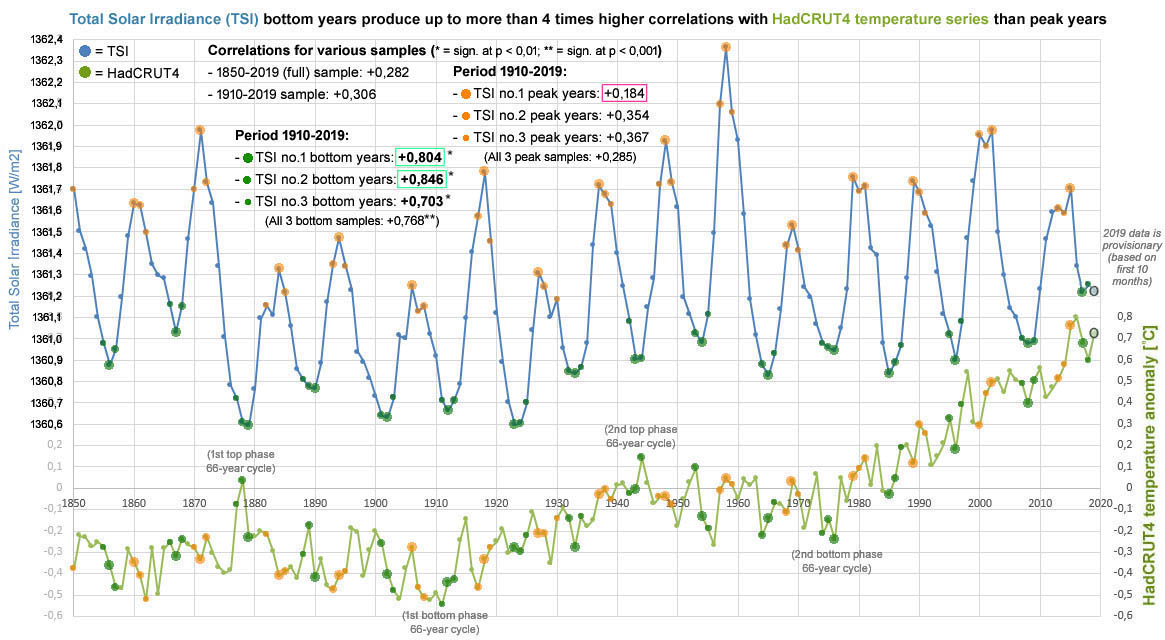
Figure 1: Minimum years in the solar irradiance cycle correlate with temperature more than 4x higher than maximum years.
Because in the perspective of the sunspot cycle the year 2019 represents very likely the minimum year between cycle 24 and cycle 25, account has been taken for the possibility that the TSI could also end at a lower value than 2017. However, based on the TSI raw data from the first 10 months of 2019 this appears unlikely; the difference compared to 2018 is limited to a value that is clearly no more than 0.03 W/m2 lower than the value of 2018. Therefore, the TSI shown in Figure 1 shows for the year 2019 a provisional value of 1361.226 W/m2, which is 0.030 W/m2 lower than the 2018 value of 1361.256 W/m2. Because corrections will be applied to the LISIRD TSI data produced by the instrumental measurements, account has been taken for the possibility that the downward effect could possibly turn out 1/3 part larger than what the raw data shows for the first 10 months of 2019. Even in that case the LISIRD TSI value for the year 2019 remains just above the 2017 level (1361,215 W/m2), so this would not have any impact on the results and conclusions presented in this article. The definitive result of the analysis in this article can therefore only be made after the end of 2019 when the LISIRD TSI value for the present year becomes available.
{II-3} Figure 1 also describes that when the phases belonging to the 3 lowest minimum years are combined (+ the 3 highest maximum years are combined likewise), the result has a very significant statistical impact. The dynamics involved also suggests that the minimum years play a leading role in the creation of the 66-year cycle. Because in this perspective both the peak years 1878 and 1944, as well as the bottom years 1911 and 1976, relate to the 3 lowest phases in the solar irradiance cycle.
{II-4} Moreover, 3 of the 4 most extreme years in the 66-year cycle show a pattern which suggests that a combination of minimum years are involved. Only the first bottom phase of the 66-year cycle exhibits a pattern around the year 1911 which is surrounded by several maximum years. This represent a curious formation because, logically, the TSI (read: the amount of solar irradiance) can actually be expected to correlate positive with temperature on earth. It is remarkable that the maximum years manifest solely at the extremes of the 66-year cycle near the very lowest bottom phase (around the year 1911) for the period since 1850.
{II-5}
In summary, for figure 1 the most sensible expectation is only clearly met for the minimum years. The maximum years appear to have caused much of the 'climate noise' in the development of temperature. Only for the period after 1944 a clear pattern becomes manifest visible where relatively many solar maximum years are spotted at the upper side of the HadCRUT4 temperature series (combined with many bottom years at the lower side). However, the period between 1850 and 1900 in particular shows more or less the reverse pattern.
Because a higher level of variation is seen for the period between 1900-1944, these phenomena can be associated with a long-term solar cycle that potentially includes multiple 66-year cycles. For, the period 1850-2018 exhibits a pattern that might represent no more than half of a shift within the mechanism. In section VI figure 12 describes more details for this pattern.
Physical mechanism explains the impact difference between solar minima and maxima
{II-6} The fundamental logics behind the difference between the solar minima and maxima can be understood with the use of helioseismology. During the minima a lower frequency5 is found at the pressure component in the sun's energy waves combined with: a larger amplitude + a larger number of active regions6. At the maxima, the reverse pattern is found: the frequency is higher but the amplitude + the number of active regions are smaller. This pattern points out that minima are accompanied with a more powerful low-frequency energetic solar activity; this results in a more clear relationship with temperature development on earth. The maxima are accompanied with less powerful high-frequency energetic activity, which explains why 'climate noise' is more commonly observed during maxima. This is probably because the Earth's atmosphere can more easily reflect (Albedo) the less powerful high-frequency energy or absorb it in the higher atmosphere.
{II-7} A closer inspection of the course of the minima at the TSI with the corresponding temperature has revealed a strange phenomenon. From the year 1867 an opposite movement is found between both factors: every rise (or fall) between 2 consecutive TSI minima is accompanied by a fall (or rise) of the temperature. The next section describes that this phenomenon is the result of a phase difference between the TSI and the temperature development.
III - After phase correction solar minima show an even stronger relationship with temperature
{III-1} In the previous section is described that when studying the relationship between the activity of the sun and the temperature development on earth, at least 1 complication must be taken into account, namely: a substantial correlation difference between the minimum and maximum years of the solar cycle. In this section a second complication is described which involves a phase difference.
{III-2}
Figure 2 shows the minimum years of the solar irradiance cycle (TSI) from figure 1, combined with the temperatures for those years. A phase correction has been carried out in which the TSI is positioned one cycle back in time; the most recent minimum of the solar cycle (2017/2019) is therefore shown in Figure 2 above the temperature of the preceding minimum (2008).
The result shows that the TSI and the temperature in figure 2 exhibit more or less the same 'sawtooth movement' over a period of 130 years (only in the last movement an opposite movement is found, where only the sun continues as expected moving upwards). The phase correction has the consequence that the correlation between the TSI minima and the temperature is considerably larger in figure 2 (r = +0.904; p=0.000) than in figure 1 (r = +0.803; p<0.01). Remarkable is also that the oscillating pattern of the 66-year cycle can be recognized instantly in this simplified perspective for both the sun and the temperature.
{III-3} The 'sawtooth movement' is a well-known phenomenon that is the result of the sun's 22-year magnetic cycle. This phenomenon is featured with a pattern found at the level of the 11-year sunspot cycle that consists of, among other things, high & low peaks and/or pointed & broad peaks. In the technical description at the end of section VI, this phenomenon is described with more details via a visual analysis involving the course of the solar cycle.
![Figure 2: After a phase correction for the TSI minima (these are shifted 1 solar cycle back in time), both the sun and the temperature show a clear 66-year cycle which together produce a high correlation [r = +0.904; p=0.000].](http://klimaatcyclus.nl/klimaat/pics/minimum-years-in-solar-irradiation-cycle-show-delayed-correlation-with-temperature.jpg)
Figure 2: After a phase correction for the TSI minima (these are shifted 1 solar cycle back in time), both the sun and the temperature show a clear 66-year cycle which together produce a high correlation [r = +0.904; p=0.000]. The combination of the 66-year cycle + the rising trend in solar activity suggests that potentially 75% to 95% of the temperature rise since 1976 can be explained by increased solar activity. The temperature of minimum year 2017 is missing in the illustration because of the phase correction applied to TSI (a comparison including 2017 can only take place after the next TSI minimum year that can be expected around the year ~2028).
{III-4} Figure 2 shows that a 66-year cycle is also present in the TSI minima years; periods of 3 upward cycles (~33 years) are alternated with 3 downward cycles (also ~33 years). Because of the long-term parallel 'saw-tooth movement' combination and the presence of the 66-year cycle, it is by no means surprising that figure 2 describes a very significant high correlation involving the development of the phased TSI and the non-phased temperature.
{III-5} The trend channels in figure 2 exhibits a pattern which shows that in the final phase both the TSI and the temperature have left the trend channel at the top. A comparison between the ratios of points I, II and III (right-hand side) suggests that based on the minima more than 75% of the temperature rise since 1976 can likely be explained by solar activity because of the combination of the following 3 factors:
(1) the 66-year cycle;
(2) the upward directed trend;
(3) an acceleration whereby the trend channel is left at the top-side.
{III-6} A more precise comparison between both perspectives on the basis of points A to L shows that the rise in temperature between 1976 and 2008 compared to the previous decades, has been only to a limited extent faster than the activity change at sun. The distance between the values at points A & D compared to the average distance between all points from A & E to A & L shows that the temperature (+101,3%) produces only a 5.0% higher value than the sun (96,3%). This suggests that, based on all individual minimum years, the variation in the sun's activity since 1976 might explain up to 95% of the temperature change. This relates to the fact that the sun shows a relatively stronger upward trend during recent decades than the temperature does. At the end of this paragraph it becomes clear that this striking trend is also present outside this perspective focused on the solar minimum years.
{III-7} Another interesting aspect is the fact that in the current decade the minima show an increase in solar activity that has not been present since 1850. With regard to the temperature, the fastest rise is found in figure 2 between the years 1933 and 1943. Because this analysis involves a comparison between years featured with comparable conditions at the sun, one can deduce from this that the temperature does not show an "unprecedented acceleration" in the period between 1976 and 2008. By the way, figure 1 does show for the period from 2008 to 2017 that the speed of the temperature rise is slightly higher than the rise between 1933 and 1943; however, the 2008-2017 period is also 1 year shorter. Moreover, this period runs parallel to the fastest rise in the TSI since 1850, which is another indication which suggests that the sun is involved in the rapid temperature rise.
{III-8} In paragraph II has been established that in particular the solar maxima are featured with fluctuations that are responsible for 'climate noise'. Sunspots are known to be accompanied with more complex dynamics in the solar output. To enable an analysis that extends beyond the minima of the solar irradiance cycle, it is therefore desirable to filter out the influence of the fluctuations related to the sunspot cycle. Various techniques are described in the scientific literature for the calculation of the so-called 'background solar irradiance' [BSI]7. In this study, a simple approach is used for the calculation of the BSI: the size of the sunspot cycle is subtracted from the TSI. The BSI is calculated as follows: the number of sunspots per year is divided by the annual record value, which involves 269.3 sunspots (= the average value for the year 1957); the result is removed from the TSI value. Figure 3 shows the TSI cycle, the BSI cycle and the sunspot cycle for the period 1800-2019; values are based on the first 10 months (Jan to Oct).
![Figure 3: Total solar irradiance [TSI], background solar irradiance [BSI] & sunspots (2019 data is based on first 10 months).](http://klimaatcyclus.nl/klimaat/pics/total-solar-irradiance-background-solar-irradiance-and-sunspots-2019-provisionary.jpg)
Figure 3: Total solar irradiance [TSI], background solar irradiance [BSI] & sunspots (2019 data is based on first 10 months).
{III-9} Figure 3 shows that the BSI reached a new record value in 2015; the average BSI value for the 2010-2019 period also results in a firm new decadal record. This is hardly surprising; for, the TSI also shows a record high level for the minimum year 2017 in the perspective of the minima. And a 10-year lasting period will be formed in 2019 during which the yearly TSI has remained constantly above a value of 1361.2 W/m2, which is also record for the period since the Maunder minimum.
{III-10} Figure 4 shows the same perspective described in figure 1, but here both the BSI and CO2 have been added as well. The dynamics of the graphs show instantly that the 'oscillating movement' in the temperature graph can only result from sun - although a low amplitude oscillation is also visible in the CO2 graph for the period 1923-1976. The solar cycle period 1933-1943 shows the slightest CO2 increase, which can be associated with both the fact that the period 1933-1943 also shows an almost flat BSI; the preceding period 1923-1933 is also featured with an almost flat temperature development.
![Figure 4: Total solar radiation [TSI], background solar radiation [BSI], temperature & CO2 based on the TSI minimum years; these factors all show strong correlations with each other (after a phase correction in which both the TSI and BSI have been shifted one solar cycle back in time).](http://klimaatcyclus.nl/klimaat/pics/bottom-years-background-solar-irradiance-show-strong-correlations-with-HadCRUT4-temperature-and-CO2.jpg)
Figure 4: Total solar irradiance [TSI], background solar irradiance [BSI], temperature & CO2 based on the TSI minimum years; these factors all show strong correlations with each other (after a phase correction in which both the TSI and BSI have been shifted one solar cycle back in time).
{III-11}
Figure 4 shows a correlation for the the BSI with temperature that is a bit stronger than the correlation for CO2 with temperature. The BSI, temperature and CO2 show correlations of comparable size. The TSI correlations are clearly lower, though the difference is limited for both the 1867-2008 and the 1976-2008 periods.
Numerically, the correlations are a few hundredths higher for the periods starting from 1879 and 1890; in case of the BSI, the correlation with temperature in both periods then exceeds +0.94 (the correlation between CO2 and the temperature remains below +0.91 in both periods).
IV - Sun shows a strong relationship with average temperature during a magnetic solar cycle
{IV-1} In paragraph III has been established that particularly for the solar minima the correlation with temperature become quite high correlations - especially after a phase correction. Also has been established for both the TSI and BSI that the correlation values with temperature become higher than seen for the correlation between CO2 and temperature.
{IV-2} It is desirable to study the impact of the phase difference between the sun and the temperature beyoned the perspective of the solar minima as well. However, paragraph II has shown that a relatively large amount of 'climate noise' becomes manifest particularly at the solar maximum. To reduce the impact of this complication as much as possible, an analysis has been made based on the sun's 22-year magnetic cycle - which is known to represent the fundamental determining factor in the solar cycle. For example, in science the magnetic cycle is used to predict the amplitude of the solar cycle in the future, whereby it is possible to look ahead fairly accurately up to at least 9 years8. This phenomenon indicates that the phenomenon of the total solar irradiance cycle is lagging behind other solar cycles.
{IV-3} The following analysis is focussed on the average values per magnetic cycle; only periods that start (and end) at TSI minima are included in the analysis. This implicates that in the analysis every magnetic cycle contains a total of 3 minimum years; the weight of the solar minimum years is used optimally. Each magnetic cycle is approximately 22 years in length and contains two sunspot cycles - each has a lengt of approximately 11 years. Because a magnetic cycle can start at any minimum, this analysis method allows to calculate the average value of a magnetic cycle for periods that follow each other with approximately 11 years.
{IV-4} Because the TSI value in 2017 is lower than in 2018 (and probably lower than 2019 as well), the analysis is focussed on a 161-year period from 1856 to 2017. The period prior to the year 1856 is not taken into account, because the period 1850-1855 does not include a full magnetic cycle.
{IV-5} Figure 5 describes the TSI, BSI, temperature and CO2 based on the individual years for the period 1956-2017; afterwards figure 6 shows the average values per magnetic solar cycle based on the values in figure 5.
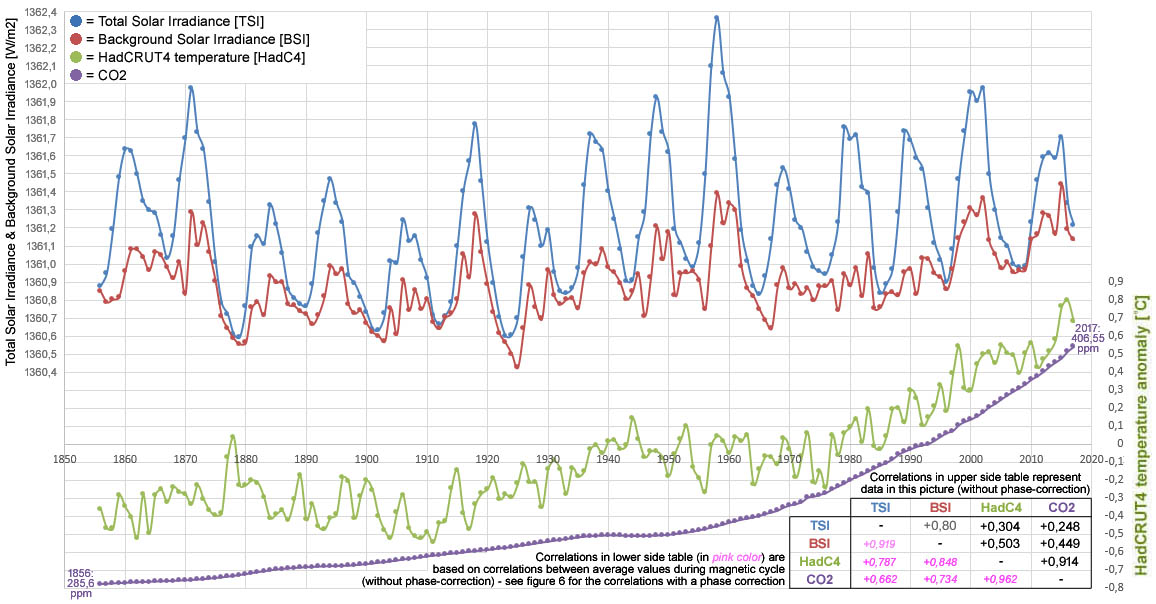
Figure 5: Annual data for the TSI, BSI, temperature & CO2 involving the period 1856-2017.
{IV-6} In figure 5 the table shows in the upper half correlations that relate to all years in the period 1856-2017; the correlations in the lower half relate to the average values based on magnetic cycles (without phase correction) that start with a minimum year. The values in the table show that the correlations between the sun and the temperature based on the magnetic cycle values are considerably higher than the correlations based on individual years (the significance levels are not shown but these are also higher). The analysis suggests that a large part of the 'climate noise' in the relationship between sun and temperature can be filtered out by taking into account the magnetic cycle of the sun. This is partly due to the fact that the dynamics of the 'sawtooth movement' is filtered out by means of this approach (this phenomenon is discussed in paragraph III).
{IV-7} In figure 6 the table shows in the lower half the correlations after including the phase correction (which was mentioned earlier); the upper half of this table shows the corresponding values for the period that involves the past few decades. Because the value for the last complete magnetic cycle relates to the period 1996-2017, it gets linked to the midpoint year 2006. Because of the phase correction, the associated TSI value is shifted one solar cycle back in time; therefore the analysis in figure 6 ends at the year 1996.
{IV-8} A comparison between the lower half of the table in figure 5 and the lower half of the table in figure 6 shows that the impact of the phase correction is significant: the correlations between the sun and the temperature increase by around 8 up to 10 hundredths when the phase correction is used. However, the impact of the choice to calculate the average value on the basis of 1 magnetic solar cycle appears to be even larger. This sheds a new light on figure 2, because in that perspective the correlation is also about 10 hundredths higher compared to the correlation described for the solar minima years in figure 1.
![Figure 6: Average values during a magnetic solar cycle (~22 years); after applying the phase correction to the data from the sun a similar oscillation pattern is found; the background solar irradiance [BSI], the temperature and CO2 have mutual correlations with approximately the same level of significance.](http://klimaatcyclus.nl/klimaat/pics/magnetic-cycle-average-for-solar-irradiance-shows-strong-correlations-with-HadCRUT4-temperature-and-CO2.jpg)
Figure 6: Average values during a magnetic solar cycle (~22 years); after applying the phase correction to the data from the sun a similar oscillation pattern is found; the background solar irradiance [BSI], the temperature and CO2 have mutual correlations with approximately the same level of significance.
{IV-9} The correlations in Figure 6 show that the BSI (after phase correction) has a remarkably strong correlation with CO2 for the period starting from 1976. This involves a parallel with figure 4, where this is also seen in the perspective of the minimum years (likewise after phase correction). Because in both perspectives correlations are found with approximately the same significance level between the BSI, temperature and CO2, this creates a pattern which suggests that the sun likely plays a significant role in both the rising temperature trend and the rising CO2 trend.
{IV-10}
A comparison between figure 6 and the combination of figures 2 & figure 4 shows that up to 1996 the graphs show sort of the same dynamics. The main difference is that in figure 6 both the 'sawtooth movement' and the 66-year cycle have disappeared and appear to have been replaced for a more gradually oscillating movement.
It is also interesting that in figure 6 the BSI reached a record level within 42 years after the previous peak (around mid-20th century). This apparently results in a delayed parallel with the temperature development - where a record level is already reached after 33 years. At the TSI the delay is even larger: the record level is reached after 54 years. In the perspective of the minima, the record levels are found about 1 solar cycle longer for both the sun and the temperature - this can probably be attributed to a delay due to the 'sawtooth movement' caused by the magnetic solar cycle.
{IV-11} The curves in figure 6 offer insufficient clues to make a reliable numerical estimate for the share of the sun in the temperature rise since 1976 - because only a relatively short period can be studied (the final values are associated with the year 1996). However, the BSI shows a strong slope that puts the curve clearly above the bandwidth of previous decades - which results in a parallel with the 'acceleration' described for figure 2 and also with the recent records described for figure 3.
{IV-12} The overall dynamics suggests that the magnetic solar cycle is most likely as well responsible for a significant part of the 'climate noise' that masks the relationship between the sun and temperature development on Earth. The combination of the use of average values during a magnetic solar cycle (based on minimum-to-minimum years) + the phase correction with the size of half of a magnetic solar cycle (= a full solar irradiance cycle) appears to be an effective strategy to eliminate the impact of the 'climate noise'.
{IV-13} Unfortunately, it is difficult to apply this strategy directly to the individual years because of the fluctuating length of the magnetic solar cycle.
V - Magnetic solar cycle provides additional evidence for a reinforcing mechanism
{V-1} Sunlight supports all forms of life on earth through photosynthesis and is also the driving force behind all climate and weather conditions. During the Maunder minimum, the sun's magnetic cycle disappeared between 1644 and 1692 (46 years = approximately 2x magnetic cycles) - see figure 7, which shows the full LISIRD TSI graph. For the magnetic solar cycles that start (and end) at TSI minima, the amount of years is described where the TSI value is higher than 1361.2 W/m2.
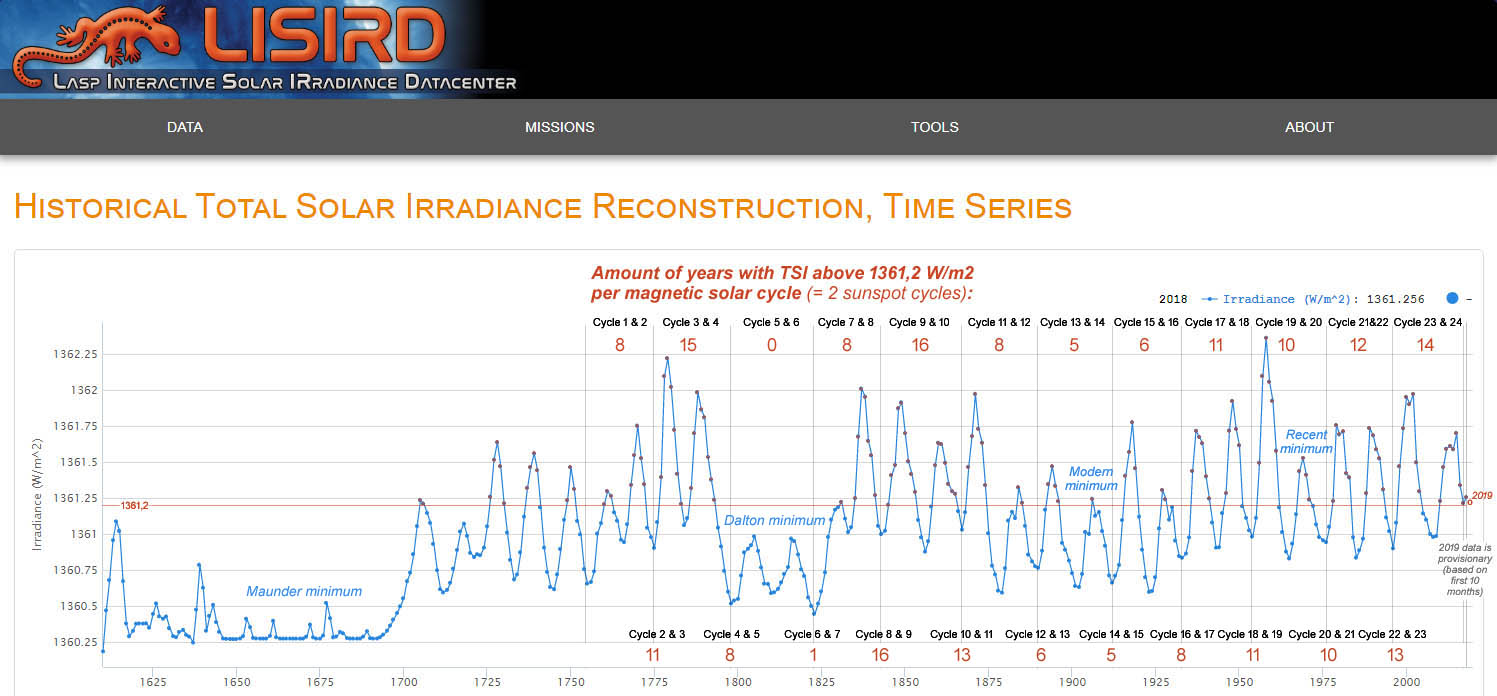
Figure 7: Amount of years per magnetic cycle where the total solar radiation (TSI) has a value of at least 1361.2 W/m2. The current decade shows for the first time a period of 10 years in a row with annual TSI values all higher than 1361.2 W/m2.
{V-2} During the Maunder minimum of the sun the bottom of the so-called 'Little Ice Age' became manifest. This period set the lowest point of the average temperature on earth since the start of the current Holocene, which began 10,700 years ago after the last (great) Ice Age. This is confirmed by the HadCET temperature graph for Central England, which involves the longest running local temperature series worldwide based on instrumental measurements. Figure 8 shows that the long-term average of the HadCET reached a low point around the year 1692. Figure 8 is also an illustration from the August 2019 article which already pointed at the parallel between the temperature development and the increased activity of the sun. An interesting aspect in figure 8 involves the oscillating movement that becomes manifest in the temperature graph and in both the sun spots and the solar radiation as well. All three perspectives show that the greatest fluctuations already arose in the 18th century. Unfortunately a comparison with the global temperature series based on instrumental measurements is not possible because the HadCRUT4 - which represents the longest running global temperature series - only starts from the year 1850.
![Figure 8: The temperature development in Central England (1659-2019) exhibits a clear parallel with both the sunspots [fig.1] and the TSI [fig.8] over a period of 300 years.](http://klimaatcyclus.nl/klimaat/pics/300-jaren-trend-temperatuur-centraal-Engeland-vs-totale-zonnestraling.jpg)
Figure 8: The temperature development in Central England (1659-2019) exhibits a clear parallel with both the sunspots [fig.1] and the TSI [fig.8] over a period of 300 years. In all three perspectives the greatest fluctuations became manifest in the 18th century.
{V-3} The temperature graph for Central England shows that between the 1690s and the beginning of the 21st century England has been confronted with a temperature rise of approximately +2.3°C. Parallel to this development it has been established in the previous paragraphs that solar activity reached record high levels during the past decades, cumulatively and based on individual years as well. Both the TSI and BSI also show records for the current decade. In the final paragraph is described that the LISIRD is consistent with the data from Wang et al. (2005), which is also mentioned in the TSI reconstruction above (Fig. 8).
{V-4}
Within the scientific framework a reinforcement mechanism is required in order to explain the warming in terms of the radiative forcing based on relatively small fluctuations in solar activity. Fluctuations inside the 11-year solar cycle, which have a magnitude order of approximately 0.1% of the TSI, correspond to a temperature difference of almost 0.2°C (0.18°C); however, earlier in the 21th century the size of this effect has estimated too low - usually with a value in the order of only 0.1°C9.
These estimates are often based on an analysis which covers only a few decades. Nevertheless, some climate models are still suggesting that the temperature impact of the solar cycle is only a few hundredths of a degree Celsius. Examples of these are the climate model presented by CarbonBrief (2017) and the climate model by Haustein et al. (2019); both models do not take into account the magnetic cycle of the sun, nor do they take into account the existence of a reinforcing factor with regard to the impact of the sun's output. The Carbonbrief model suggests that the sun has "most likely" caused cooling in the last 5 decades, assuming that the size of the TSI has a direct proportional effect on temperature. Based on the analysis in section II, it can be stated that such an assumption is based on a fundamental misconception about the impact of the sun. By the way, in a different CarbonBrief article the role of the sun is being trivialized, but there is no reference made at all to the most important aspect in the complex of solar cycles: the magnetic solar cycle.
{V-5} The relationship between the solar (spot) cycle and the temperature is by no means easy to describe; however, the following is crucial:
{V-6}
The sun's magnetic field is produced by the so-called 'solar dynamo' - which consists of a poloidal component (formed by the magnetic north pole and south pole) and a toroidal component (formed by an internal magnetic field which develops around the solar equator). These components of the 'solar dynamo' are out of phase to each other; only the toroidal component runs synchronously with the solar (spot) cycle.
Figure 1 has shown that only a weak correlation is found between the solar cycle (read: the toroidal component) and temperature; also, even a small negative correlation (non-significant) is found between the TSI and the ENSO cycle. However, figure 9 shows that for years when the northern poloidal component becomes neutral it does show a particularly strong relationship with the ENSO cycle. This is important because the ENSO cycle is known to be responsible for the largest temperature fluctuations between successive years.
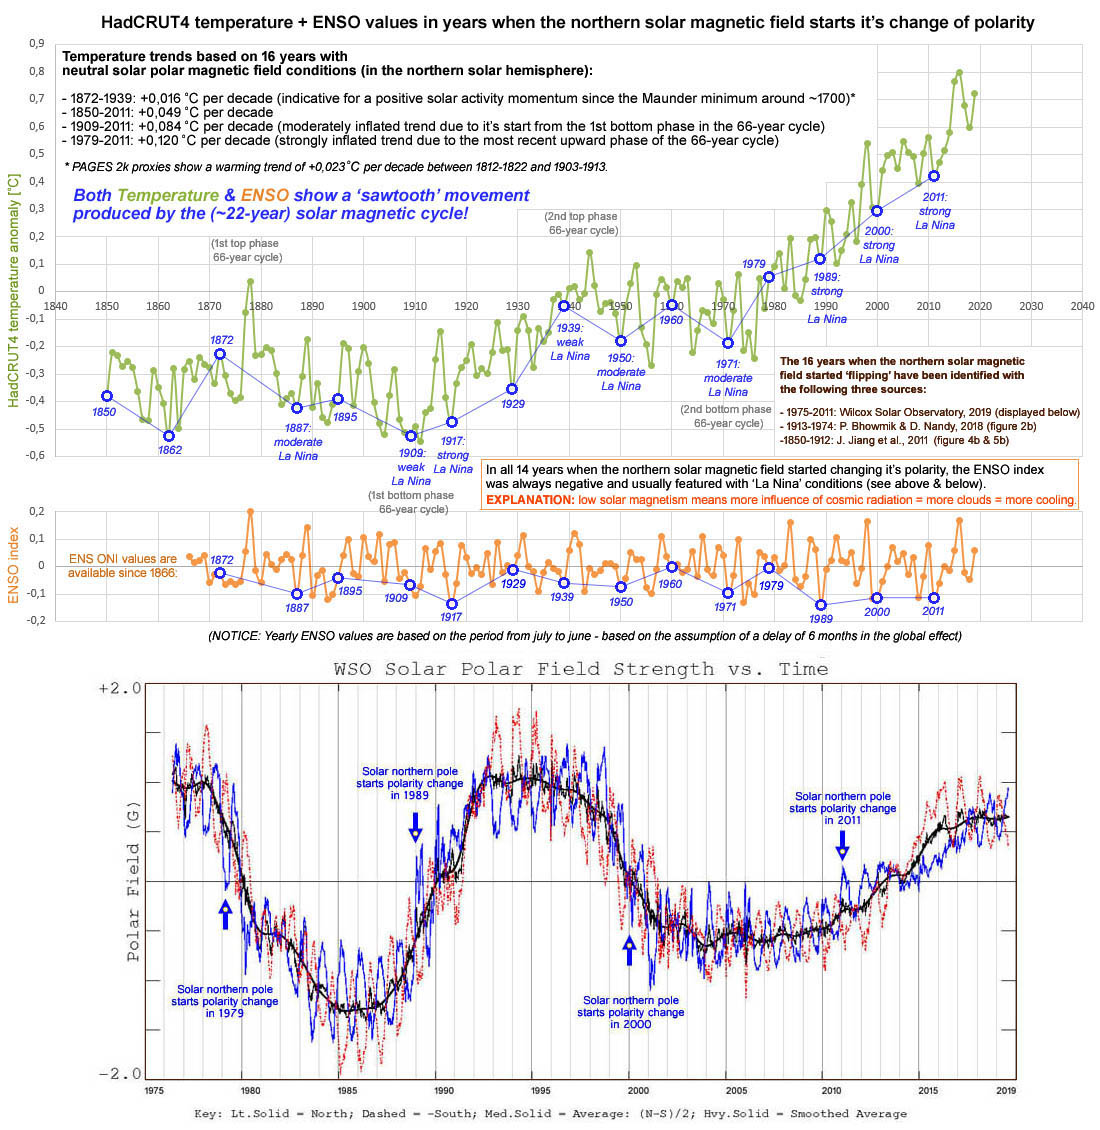
Figure 9: HadCRUT4 temperature + ENSO values in years when the magnetic north pole of the sun changes polarity10,11,12. NOTICE: In accordance with the analysis presented in August 2019, ENS ONI data has been used for each year based on the period July to June (with the assumption that the impact of the ENSO cycle has a delay of several months for it's global impact). In the additional illustration a comparison is made as well based on ENS ONI values without the 6-month delay; the effect is still clearly visible, but the impact is then less strong.
{V-7} Figure 9 describes that in years when the magnetic field of the sun's north pole starts changing polarity, a negative value is always found in the ENSO cycle; negative values are usually accompanied with La Nina conditions (= the counterpart to El Nino). This phenomenon partly explains the formation of the 2 strongest La Nina years, which involves the years 1917 and 1989. The Ensemble Oceanic Nino Index starts in the year 1866.
{V-8} With regard to the physical mechanism, this phenomenon fits seamlessly with one of the most important candidates for the creation of an amplification mechanism13. When the poloidal component of the sun's magnetic field is low, there are not only more sunspots, there is also more space availablefor the influence of cosmic radiation. Cosmic radiation brings more high-energy particles in the Earth's atmosphere, producing more low-hanging cloud formation, which results in more cooling14.
{V-9} The quotation below illustrates that the solar magnetic field [= magnetic flux leaving the sun] has increased sharply since the Maunder minimum with an additional effect which involves a halving of the cosmic rays that reached the earth [GCR = galactic cosmic rays]15:
"Measurements show that between 1964 and the 1990s the total magnetic flux leaving the Sun (solar wind) increased by a factor of 1.4 with surrogate measurements indicating that it increased since the Little Ice Age by 350%, while the GCR flux decreased by about 50% to reach a low in the 1990s."
{V-10} These dynamics also indicate that the sun probably also plays a role in the emergence of the ice age cycle, which only partly can be explained with the Milankovic cycles. There are also related claims that the sun is involved in the formation of Dansgaard-Oescher cycle13. Proxies indicate that in the distant past there have been about 25 periods with a length of only a few decades (possibly only a few years), showing temperature differences in Greenland with an order of magnitude of ~10°C - which is clearly larger than the differences recorded at the North Pole in the current period. Although, it should be noted that this phenomenon usually occurred during an ice age. This phenomenon is primarily an illustrative example which shows that high natural variability in the Arctic region has been relatively common in the distant past.
{V-11} Figure 10 describes a 2nd mechanism that provides a deeper insight in the relationship between the various solar cycles and the manifestation of periods of cooling on earth. Figure 10 shows that multi-decadal cooling occurs around periods when both the TSI and the solar angular momentum (= Jose cycle, more information on this is described at the end of the next paragraph) are in a minimum/bottom phase.
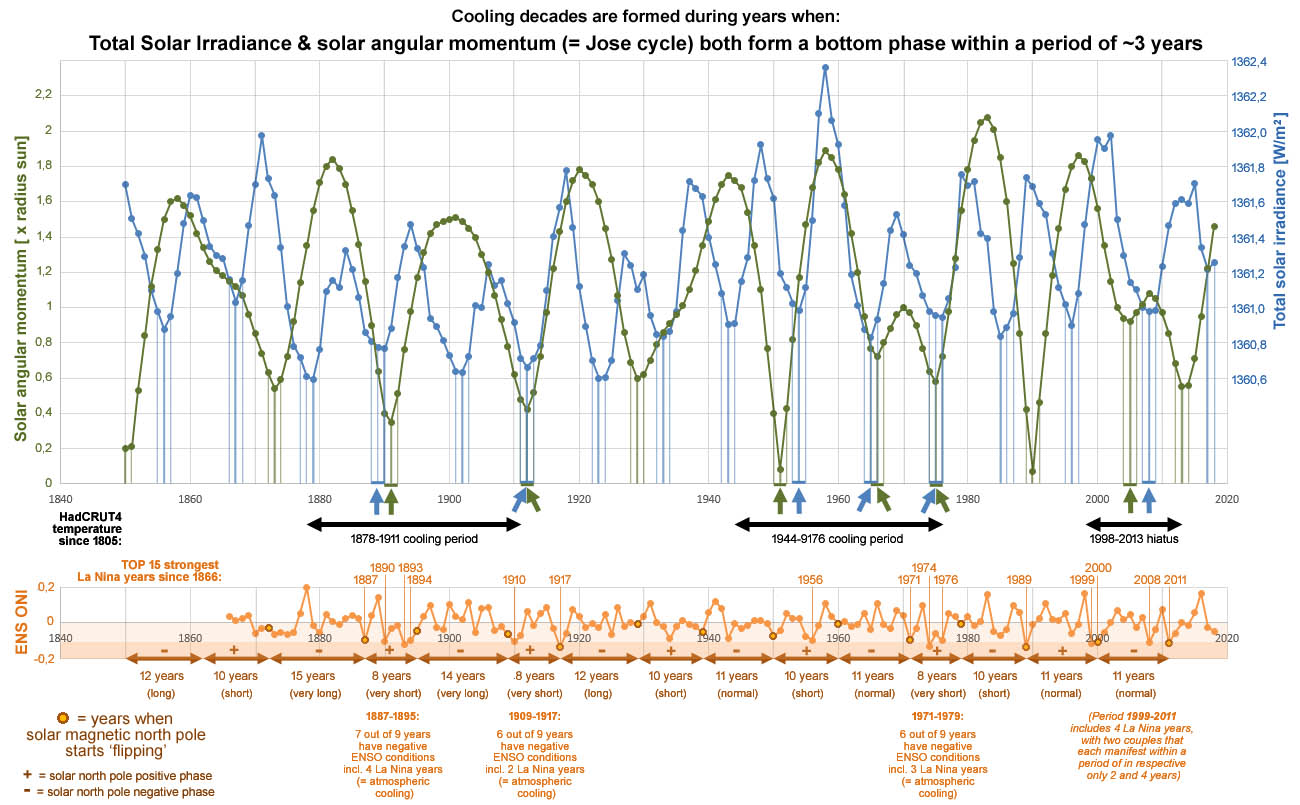
Figure 10: The concurrence of the bottom phase during the sunspot cycle & the bottom phase in the solar angular momentum becomes only manifests in periods of cooling, or in periods without warming.
{V-12} And finally, figure 10 also shows that the periods which show the largest overlapping minimuma coincide with the shortest periods (length: only 8 years) between 2 succeeding years when the magnetic solar north pole starts it's process of polarity change. Figure B1 in the appendix presents a detailed description of the phase differences between the various solar cycles for the satellite period since 1976.
VI - Sun is responsible for the 66-year cycle + part of the upward trend channel
{VI-1} The August 2019 analysis describes the 66-year cycle for the very first time combined with an estimate for the underlying speed in temperature rise during the recente decades (after correction for the upward phase of the cycle). This earlier analysis described a cycle amplitude of 0.12°C + a trend channel which shows an increase of approximately +0.09°C per decade. The possibility was taken into account that the sunspot cycle (in the form of the Suez/de Vries cycle) might play a role in this; however, back then the estimate was made that this influence might have been small: "Since the 2nd half of the 1960s, a slight increase in 'total solar radiation' has had a small share in the creation of the trend channel". However, in the present article it has become clear that the sun can potentially explain both phenomena: the cycle + the underlying rising trend channel. A detailed description for both phenomena is presented below.
• Amplitude 66-year cycle is considerably larger than previously estimated
{VI-2} Based on similar conditions at the sun, it can be determined that:
- an amplitude of approximately 0.16°C is found at the minimum years in the solar cycle (see figure 1);
- an amplitude of approximately 0.195°C is found in the years with a low poloidal magnetism (see figure 9).
{VI-3} Both perspectives together show an amplitude featured with an average value of almost 0,18°C, which is considerably higher than the estimate presented in the August analysis (0,12°C). Subsequently, an additional analysis is therefore made for the TSI in figure 1 based on the 3 lowest minimum years (average amplitude: 0,233°C) and the 3 highest maximum years (average amplitude: 0,139°C); interestingly, in 3 of those 6 years an amplitude is found that is higher than 0.20C. This more comprehensive analysis results in an even slightly higher average value: 0,181°C. From this can be deduced that the amplitude has probably been underestimated in the preceding analyses due to the use of a conservative technique, where 'climate noise' has suppressed the outcome. However, this outcome actually confirms an aspect from the August publication discussion. For, the scientific literature does report an amplitude of 0,17°C based on Fourier analysis16. Moreover, it is remarkable here to notice that a structured analysis based on comparable solar conditions has again unveiled another striking difference: the solar minima produce an average amplitude that is no less than 60% larger than the amplitude produced by the maxima.
{VI-4} Finally, it can also be mentioned that the PAGES 2k proxies (2013)17 show an amplitude of only 0.079°C based on the average values during a magnetic cycle (see figure 11). It appears that a significant part of the amplitude becomes masked by 'climate noise'.
• Sun is responsible for a substantial part of the upward trend channel (PAGES 2k proxies > HadCRUT4)
{VI-5} The previous paragraphs describe that solar activity shows a clear increase during the past 300 years since the Maunder minimum. Figure 9 describes for the HadCRUT4 that in years featured with low poloidal magnetic activity (specificly involving the years when the magnetic north pole starts a change of polarity) a temperature increase of by average +0.016C per decade is observed for the period 1872-1939.
{VI-6} Figure 11 describes for the PAGES 2k proxies (2013)17: between the coldest 11-year period at the start of the 19th century (1812-1822 during the Dalton minimum) and the coldest 11-year period at the beginning of the 20th century (1903-1913 during the Modern minimum) an average temperature increase of +0.023°C is found. For the period 1812-1939 (a period of 127 years), this results in a pattern with dynamics which show that the sun can be held accountable for a temperature rise of at least approximately +0.020°C on average per decade. Both the data and the dynamics described in figures 1 to 6 offer no basis at all to assume that this trend has decreased in the period 1939-2019. This implicates that with regard to the trend channel of +0.09C per decade in the analysis of August 2019, the PAGES 2k proxies show that at least about +0.02°C per decade can be attributed to the long-term trend due to the increased activity of the sun. Possibly even a bit more, because in figure 11 the PAGES 2k proxies for the period 1810-1902 show an even higher trend of +0.0316°C per decade. Moreover for the period 1810-1996 the average trend is only slightly higher: +0.0382°C per decade.
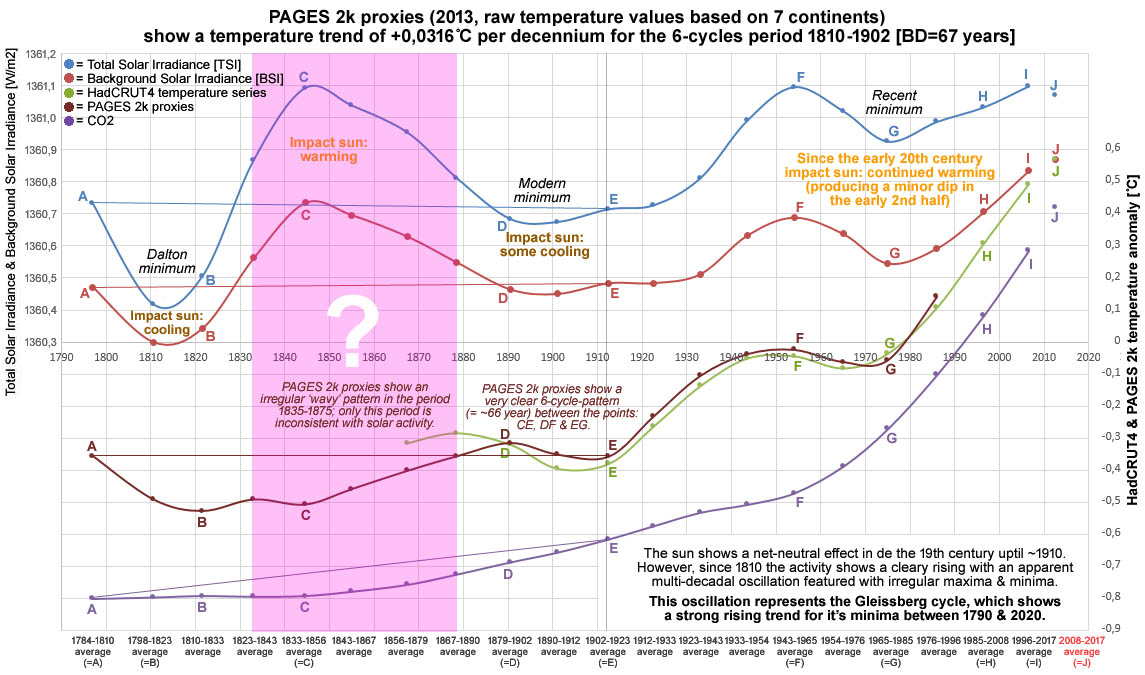
Figure 11: TSI, BSI HadCRUT4, PAGES 2k & CO2 values per magnetic cycle based on periods that start and end at TSI minima; the values are shown at around the intermediate minimum. A fully magnetic cycles includes a total of 3 TSI minima. PAGES 2k proxies (2013)17 show a temperature trend of +0,0316°C per decade for the period 1810-1902 (based on raw proxy temperature values of the weighted average for 7 continents, including Arctica; only Africa is missing).
{VI-7}
Figure 11 shows that solar activity and the combination of the HadCRUT4 & PAGES 2k proxies present an overall picture featured with an inconsistency in the period 1835-1875 only. However, between the HadCRUT4 and the PAGES 2k proxies, an inconsistency is also present during the decades preceding point D at the year 1890. So, the inconsistencies mainly manifest themselves in the period prior to the 20th century. Nonetheless, little net change is found in both the sun and the PAGES 2k proxies during the full 19th century. Therefore, the period with the greatest inconsistencies appears to have had little impact on the net result of the developments in the 19th century. Nevertheless, the correlation between the sun and the PAGES 2k proxies is negative; the use of the phase correction does not eliminate the negative correlation neither.
Using the assumption that the sun also has an indirect cumulative effect (after all, the ocean system stores a large part of the collected solar radiation for a long period of time), an explanation can be found for the fact that the multi-decadal period with the inconsistent dynamics is preceded by the Dalton minimum. During the Dalton minimum the sun has been active at a relatively low level, which means that the ocean system has probably lost a large amount of stored solar energy. It's possible that so much energy was lost that in the first decades after the Dalton minimum (between points B and D) solar radiation was first mainly stored and relatively little heat was released in the atmosphere. The equilibrium in the ocean system recovered a few decades later, after which a clear relationship became visible again starting from point D between the activity of the sun and the development of the temperature. High consistency is also present in period leading up to the Dalton minimum (between points A and B). This potential scenario might also provide a sort like explanation for the occurrence of the phase difference described in paragraph III. In periods when the sun is inactive, the ocean system starts reacting to the sun with a delay, while the inverted apparent effect may arise during active periods - perhaps the many cycles in the ocean system also play a role in this (the deep sea of the Pacific Ocean has a turn-around time of more than 1000 years, so these types of processes are not easy to describe at all).
{VI-8} In this paragraph it has become clear that, based on years with similar solar conditions, a significantly higher amplitude for the 66-year cycle becomes apparent. It has also become clear that due to the increased activity of the sun since the end of the 18th century, at least a significant part of the rising temperature is explained. The preceding paragraphs III and IV describe that, the BSI produces higher correlations (than the TSI) with temperature, for: all years toghether, the minimum years, and also the average values based on a magnetic cycle. Combined with the TSI minimum highest record level of 2017 and the record high for the 10-year lasting period with anual values always higher than 1361.2 W / m2, plus the BSI record high year 2015 and the corresponding 2010s decade record level, one can deduce from this that solar activity shows a clear pattern which suggests that the temperature rise since 1976 can largely be attributed to natural variability due to very high solar activity.
{VI-9} To finalize this section, a description follows which shows that the TSI minima include a cycle of 66 years, and the TSI maxima include a cycle with a double length: 132 years - see figure 12.
{VI-10} Figure 12 also shows that the current decade (2010s) shows for the TSI a clear record with values above 1361.2 W/m2 for no less than 10 years in a row. Also, the solar activity has been at a relatively high level in the period 1998-2004: this involves a period of 7 years in a row with TSI values that are also above that level. With regard to the 22-year magnetic solar cycle in the period 1998-2019 this means that up to 17 years are found with TSI values higher than 1361.2 W/m2. In the preceding 22-year period (1976-1997), this applies to only 12 years - which was actually a record for the period up to 1997 in the 20th century. The period 1978-1999 produces for the 20th century a 22-year record period with 14 of such years. However, in the 21st century the counter up to 2018 is now already at 14 years and based on the preliminary data for 2019 it seems the record for the 20th century will probably be surpassed this year already for the 21th century. In the period starting from 1610 in total only 3 periods show a period of more than 7 years in a row with TSI values higher than 1361.2 W/m2, in respective: 1786-1793 (8 years), 1845-1853 (9 years) ) and 2010-2019 (10 years).
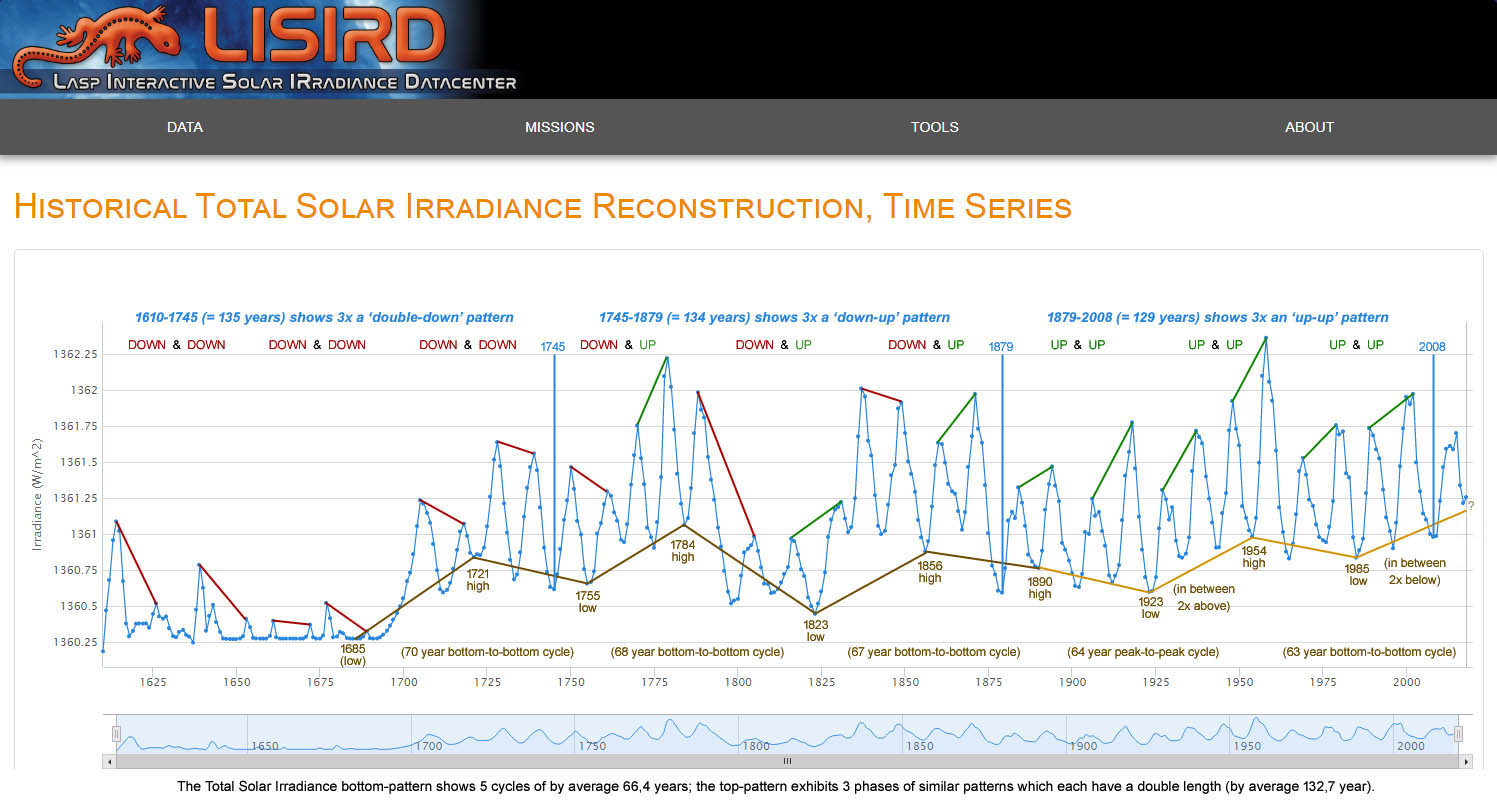
Figure 12: In the cycle of total solar irradiance, the bottom pattern and the peak pattern each show a different pattern of dynamics. The bottom pattern shows a multidecadal cycle with a length of 66 years, featured with a phase change that usually follows after every 3 solar cycles. The peak pattern shows 3 periods with a double length of 132 years (= 2x 66 years), where each period is featured with variations that relate to a combination of 2 consecutive magnetic cycles (each combination corresponds to periods of approximately ~44 years):
• 1610-1745 shows 3x two consecutive combinations with a 'downward trend';
• 1745-1879 shows 3x two combinations with a 'downward trend' followed by an 'upward trend';
• 1879-2008 shows 3x two consecutive combinations with an 'upward trend'.
{VI-11} The technical description that follows below is illustrative for the complexity of variations in the complex of solar cycles. The sun has gradually become more active during the past 300 years since the Maunder minimum, illustrated by a record high level for the perspective of the minima of the TSI that was reached in 2017 according the LISIRD (assuming that the 2019 TSI remains higher than the 2017 TSI):
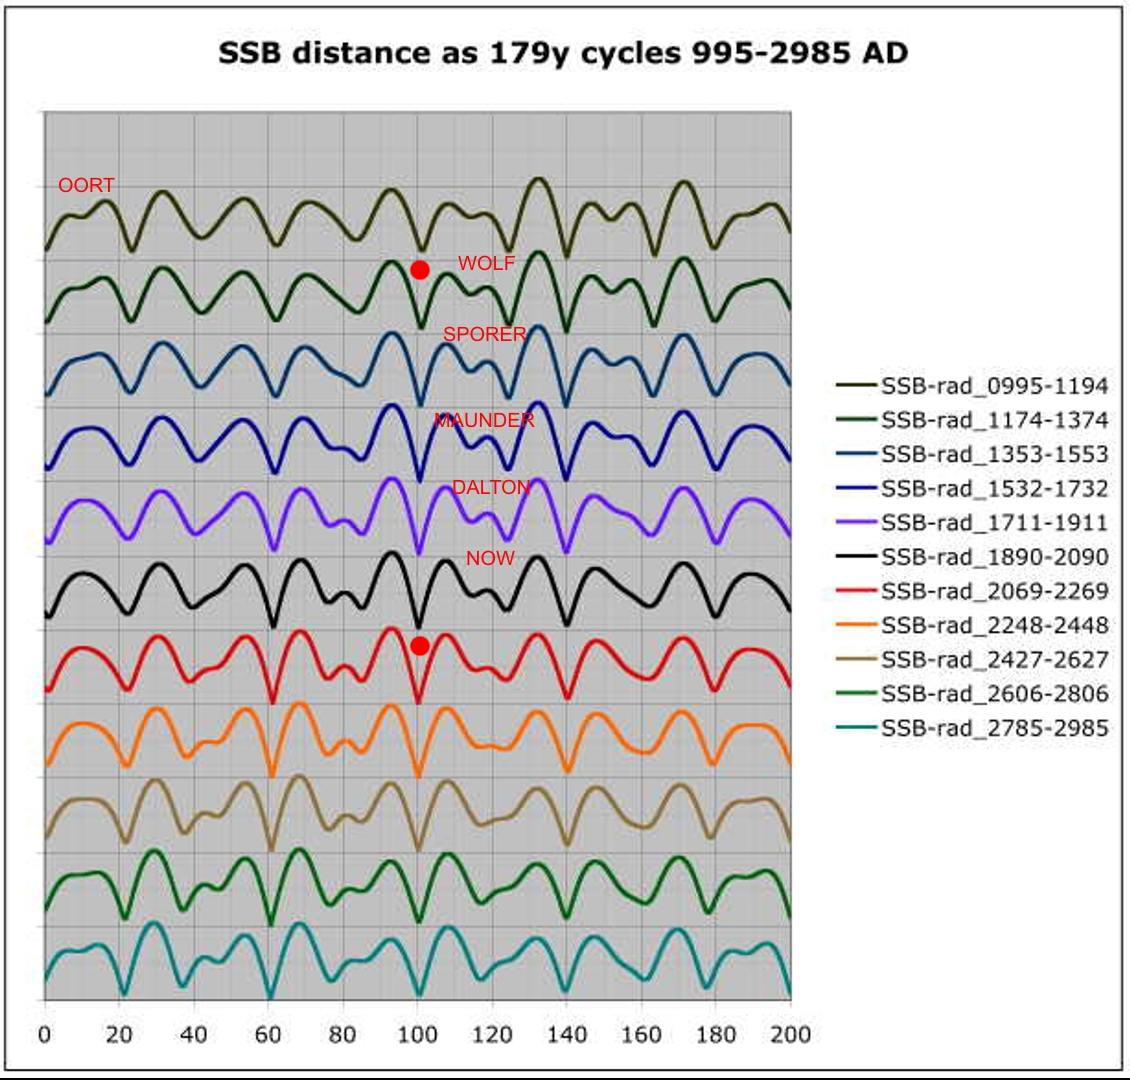
The minima in figure 12 show a succession of up- and down trends that each take around 66 years in total; this minima pattern runs 1 sunspot cycle off phase relative to the maxima pattern - which shows a length of 132 years. The irregularity visible at the minimum year 1890 (illustrated with a change of color in figure 12) coincides with the start of a new Jose cycle18. The Jose cycle has a length of 179 years; a new cycle always presents itself with a deviation in the pattern that becomes manifest featured with a relatively long cycle in the perspective of the angular momentum of the solar movement around the barycenter.
Regarding the year 1890 should also be noted that it is preceded by a combination of 2 consecutive 'negative/broad cycles' in which one 22-year magnetic cycle [= Hale cycle] has not been completed. This relates to an irregularity involving the shape ('pointed' or 'broad') of that specific 11-year sunspot cycle [= Schwabe cycle]. This phenomenon can only be observed at the level of the sunspot cycle (see figure 3); this phenomenon can not be observed at the TSI level. Normally, positive/pointed cycles alternate with negative/broad cycles; this relates to the so-called Gnevyshev-Ohl 'even-odd' rule. In the distant past there were speculations about this phenomenon involving that it could possibly occur within the Gleissberg cycle after both every long phase of ~100 years and also after the following short phase of ~80 years. By the way, the combination of the long and short phase of the Gleissberg cycle results in the Jose cycle, which has length of ~179 years19. A combination of two Jose cycles corresponds to nearly 33 sunspot cycles; this length also corresponds to the 350-400 year cycle described in the work of Zharkova - who discovered this cycle covering multi-centuries on the basis of a principal component analysis involving the 11-year sunspot cycle in relation to the 22-year magnetic cycle based on both the poloidal and the toroidal component20:
"These grand cycle variations are probed by alpha - omega dynamo model with meridional circulation. Dynamo waves are found generated with close frequencies whose interaction leads to beating effects responsible for the grand cycles (350-400 years) superimposed on a standard 22 year cycle."
VII - 'Solar sensitivity' is high & 'climate sensitivity' is low
{VII-1}
A key-point illustrative of the role of the sun is the following: figure 11 (previous paragraph) exhibits that the sun shows a relatively small decrease in both the TSI and the BSI between the 1940s and 1970s relative to the increase between the 1910s and 1940s. In the earlier analyses made in June 2019 and August 2019 it has been notified that the multi-decadal temperature cycle is accompanied with a rising slope. It is important to realize that the upward trend channel plays a crucial role in the dynamics of both the sun and the temperature.
The PAGES 2k proxies show a similar rising slope since the end of the 17th century. This implies that the temperature drop due to a lower sun activity between the 1940s and 1970s possibly has not been influenced significantly by greenhouse gases, as is being assumed in the lecture on the Dutch KNMI website. Because both the perspective of the sun and the temperature show a relatively small decline between the 1940s and 1970s due to the rising trend. This is a crucial element from which can be deduced that the impact of the multi-decadal cycle can by no means be simulated in a realistic manner by just using a simple sinusoidal model without also taking into account the upward trend in sun activity that has started in the Maunder minimum.
{VII-2} Figure 13 shows that the path of the BSI (with- and without phase correction) largely fits within the pattern of annual fluctuations of the HadCRUT4 temperature series. After the phase correction, the BSI fits entirely inside the HadCRUT4 bandwidth for the period from the 1880s to the 2010s. For the BSI variant without phase correction, it is noticeable that in the period starting from the end of the 1970s it is found clearly below the HadCRUT4 data, but the difference has narrowed down at the beginning of 2010s. The upward trend in the BSI without phase correction shows no clear difference relative to the upward trends in the course of the temperature. An additional analysis shows that in figure 13 the BSI from 1975 onwards basically increases faster than the temperature, with the exception of just one period.
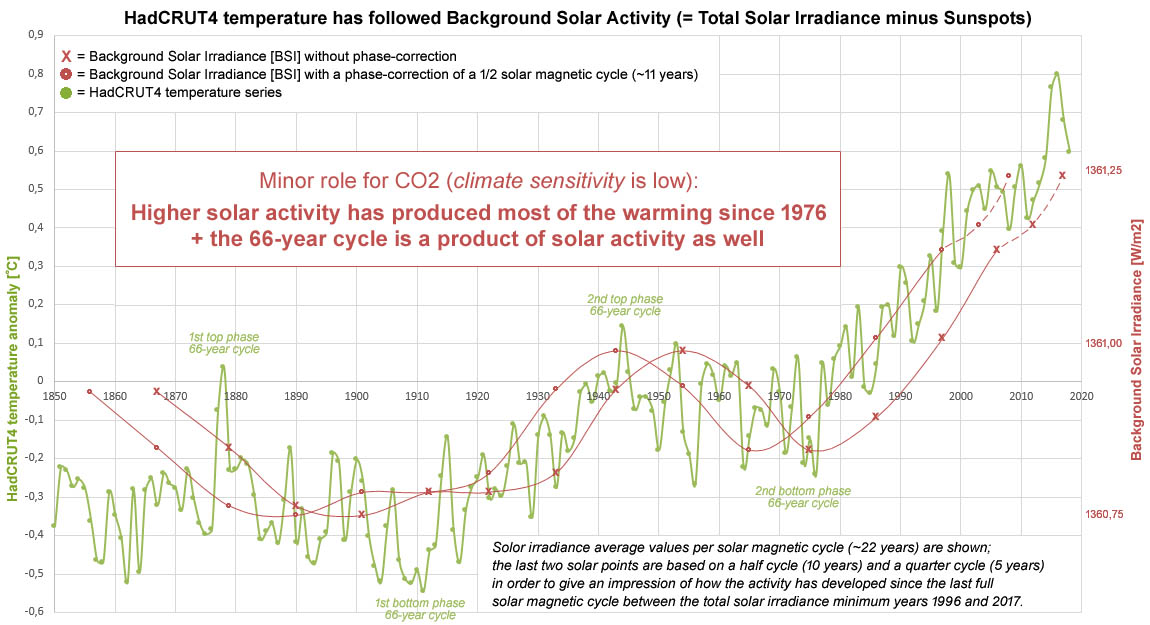
Figure 13: Climate sensitivity is low based on the background solar radiation (= total solar radiation minus impact of the sunspot cycle).
For the BSI, figure 13 shows a picture that clearly shows that there is a long-term parallel in the trend of sun activity and temperature.
{VII-3} In figure 14 the BSI, HadCRUT4 and CO2 have been slided over each other; all mutual correlations in the table are high, which is an indication that the role of the sun in the rise of temperature and CO2 as well should be underestimated. Figure 14 includes a small adaptation relative to figure 13 involging the last 2 points of the BSI curve. Based on the rising trend in the minima, it is assumed that the average BSI value for the period 2008-2017 may also become manifest during the 2020s. This explains why the phase correction for the period 2008-2017 in figure 14 is linked to the year 2008 - based on the assumption that the average value over the magnetic cycle involing the period 2008-2028 will also be linked to the year 2008 after a phase correction of 1/2 magnetic cycle. Subsequently, the average BSI value for the period 2015-2019 is linked to the year 2012. In the final part of this paragraph will be demonstrated with an additional analysis involving figure 16 that this adjustment has little impact on the result of this analysis.
{VII-4} By the way, the analysis of August 2019 (paragraph IV) describes that the temperature rise since 1850 is responsible for around 15% of the total increase in CO2. This estimate as well indicates that the impact of the sun on temperature and CO2 as well should not get underestimated.
{VII-5} Figure 14 gives rise to the question whether the sun might be taken accountable for a CO2 increase that is higher than 15%. This article started with the observation that the KNAW brochure (2011) describes that the impact of changes in solar activity on climate change is not well understood. This research makes it clear that since the end of the 19th century the sun shows a similar oscillation combined with a positive trend like is seen for the temperature; if the high correlation between the sun and CO2 is largely based on a spurious correlation, then this probably also applies to the relationship between the temperature and CO2 - after all, only 15% of the CO2 rise can be explained by the rise in temperature. Moreover, it appears that in the perspective of natural cycles CO2 always follows the temperature; no empirical evidence is available for a possible reversed relationship.
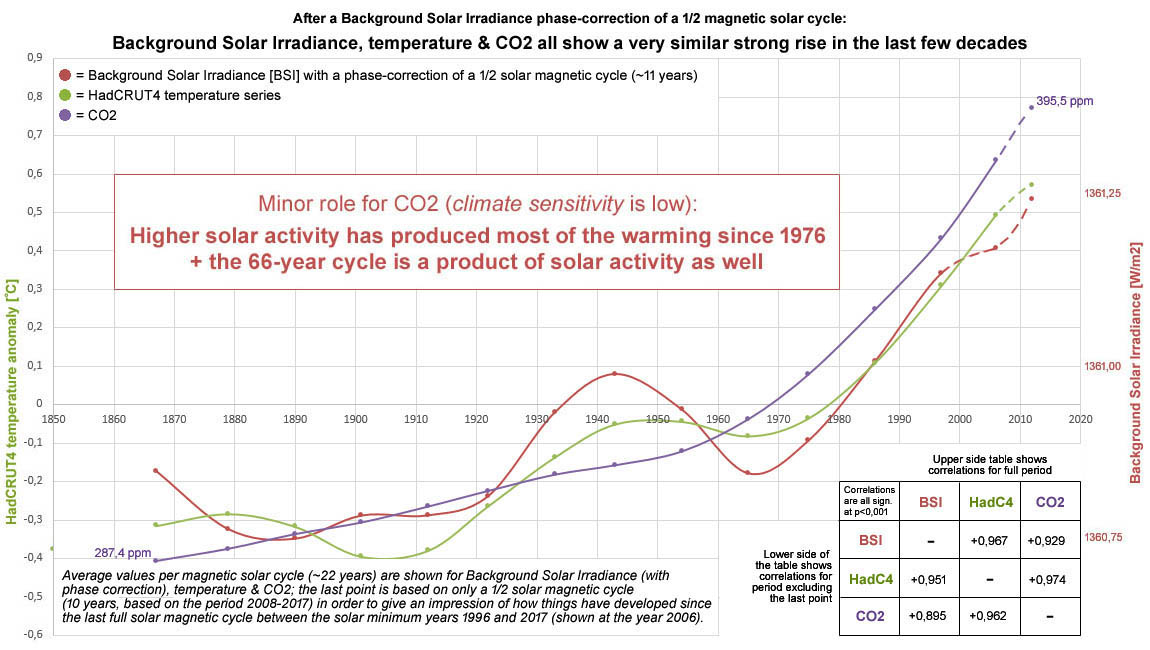
Figure 14: Background solar radiation (with phase correction), temperature and CO2 show a comparatively strong increase for the past decades based on average values during a magnetic cycle.
{VII-6} Figure 14 shows that after 2 corrections (based on a phase difference on the one hand, and on the other hand a disturbing influence of the sunspot cycle) a very strong relationship is found between solar activity and temperature. For the period that relates to the years 1890-2017, the correlation between the sun and the temperature rises to just above +0.97 (the correlation between CO2 and the temperature is a fraction higher for this period). The fact that CO2 shows a somewhat lower correlation with the sun can probably be explained on the basis of the impact of greenhouse gas emissions as a result of human activities; because possibly only about 15% of the CO2 rise can be explained by the sun; the correlation between the two factors is particullary depressed by the absence of a clear 'multi-decades oscillation' in the CO2 curve.
{VII-7}
The TSI shows a very high correlation with temperature; a combination of three factors is involved: (1) temperature and solar activity show a similar like oscillation, (2) the presence of an upward slope, (3) the presence of an extended upward phase. These 3 factors combined with the high correlation form a solid basis for concluding that the rise in temperature in recent decades can largely be attributed to increased solar activity.
The record high series described for both the TSI and the BSI, combined with slope-related records since 1850 involving both the solar cycle minima and temperature (see figure 12), represent additional support for the conclusion that increased solar activity impact in the rise of temperature and CO2 as well, should not be underestimated.
In the perspective of the minimum years, figure 2 describes that the percentage of the warming that can be explained by the sun can vary from between 75% to 95%. Figure 14 indicates that the upper limit can even be raised to 100%. Only the period prior to the beginning of the 20th century shows a pattern of dynamics that cannot be explained directly - though in the previous section has been described how the influence of the Dalton minimum may have played a decisive role for that period via a process of passive cumulation of solar energy in the ocean system - after the manifestation of a few decades when solar output was relatively low.
{VII-8} The impact of doubling CO2 is described with the term 'climate sensitivity'. The previous paragraphs have shown that particularly in the period 1890-2017 very high correlations between the sun and temperature are present. Since it is inconceivable that change in solar activity is caused by temperature fluctuations on planet earth, it is obvious that the sun is likely largely responsible for the warming that became manifest during the past 130 years. The consequence of this is that the 'climate sensitivity' (read: the temperature development sensivity on earth for a doubling of CO2) is probably low; after all, the temperature rise can potentially be fully attributed to the sun on the basis of the following 4-factor combination of factors present for both the sun and the temperature: very high correlation, longterm upward trend, corresponding oscillating pattern, and various records during the 2010s.
{VII-9}
The scientific literature describes a temperature difference between a passive sun and active sun in the order of magnitude of 1C - based on borehole proxies taken from the earth's crust or the ice caps21.
Also, it has been known since the 90s that the length of the ~11 year solar cycle (which can vary in length from 8 to 15 years) corresponds fairly accurately with the temperature development of the northern hemisphere. By the way, a 1991 study22 already presented an analysis based on the average values between both 2 maxima and 2 minima; moreover, the studie describes a strong relationship between the length of the solar cycle and the amount of sea ice around Iceland becomes visible on the basis of the average values over 22 years. With the use of that 1991 study, the remarkably strong correlation between the BSI and the temperature can be better understood as follows. The BSI is derived from the TSI combined with the factor that was the basis for the 1991 study, namely: the sunspot cycle. It has also been established that combinations of TSI proxies can produce a significant correlation with the temperature23, but in those earlier studies the magnitude of the correlations based on individual years remains far below the magnitude and the significance level reported in the present study. This subject is discussed in depth in the final paragraph by means of the use of a formula which shows that the TSI can be understood to represent a factor which includes in total 3 different components.
{VII-10} In figure 15, only the BSI scale has been adjusted (relative to figure 14); the BSI scale is made 18% larger (without distortion of the mutual relationships between the values) and subsequently it has been positioned relative to the temperature graph with the objective to create as many intersections as possible between the two graphs.
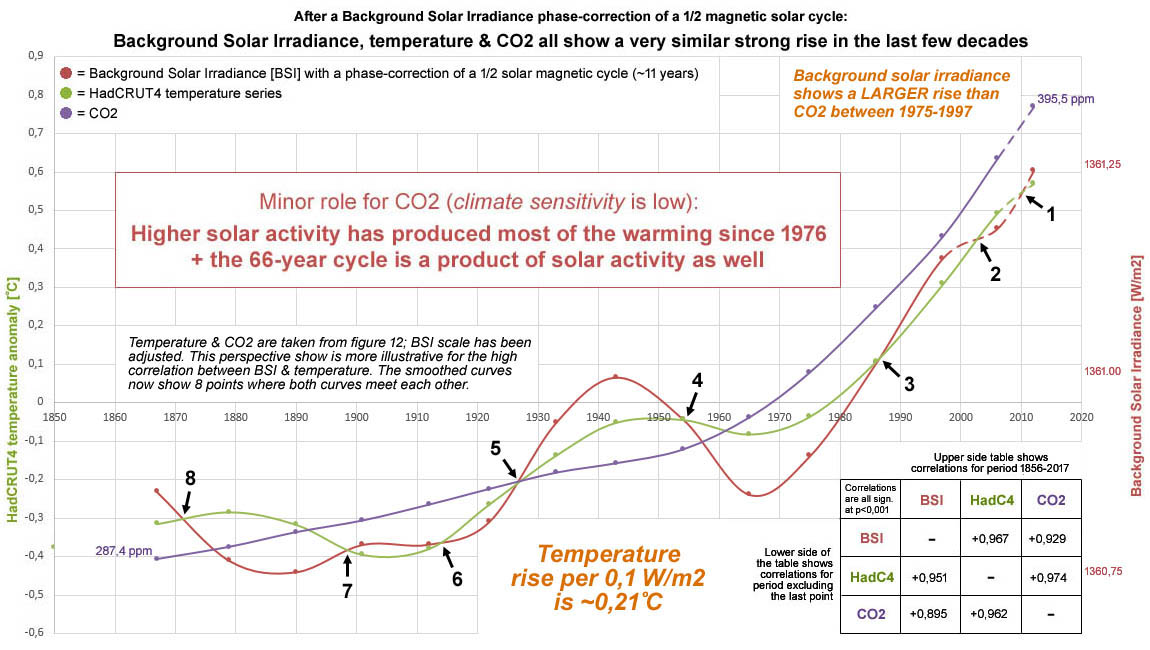
Figure 15: BSI & temperature show 8 intersections; the BSI also shows a relatively large increase in the graph between the years 1975 and 1997.
{VII-11} Figure 15 shows a remarkable pattern of dynamics involving several respects: the impact of the inconsistent pattern described in the previous paragraph for the period prior to the year 1900 appears to be smaller than previously assumed. Because figure 15 shows that the BSI and temperature are intersecting during almost the entire period; this happens no less than 8 times over a period which covers 7 magnetic solar cycles. The very high correlation combined with the high degree of overlap provide the possibility to use the scales of the graphs in order to estimate how the overall change in solar activity relates to the corresponding temperature difference. A BSI change of 0.1 W/m2 corresponds here with a temperature difference of 0.21°C; this value deviates only to a limited extent from the value of 0.18°C per 0.1% TSI change mentioned above at Wikipedia based on Camp & Tung, 2007 (the 2007 study itself also describes the effect in terms of "almost 0.2°C"). This means that the order of magnitude for the scales in graph 14 is just fine.
{VII-12} The overall picture in figure 15 is 'remarkable' because it shows that the solar variability appears to be larger than the temperature fluctuations on earth. By the way, this is also clearly confirmed for the individual years in figure 5 (paragraph IV). Also can be notifed that the two graphs usually intersect each other after a complete magnetic solar cycle has been completed. However, an intersection after 1 magnetic cycle only repeats twice in a row; this is followed by an early intersection (after a duration of ~1/4 of a magnetic cycle) followed by an intersection that takes place after ~1.75 of a magnetic cycle. After that the pattern apparently repeats itself. This shows that the very high correlation for the period 1856-2017 [r = +0.967; p=0.000] between the 'background solar radiation' and temperature on earth, reflects a complex but very high similarity between both factors.
{VII-13} And after a final step figure 16 shows the result based on the average between the BSI values with- and without the phase correction. This implies a phase correction with the impact of only 1/4 of a magnetic cycle, but the graph is putten 1/2 magnetic cycle back in time to allow a consistent comparison with the previously shown correlations. The BSI graph is hereby placed upwards by almost the same value that was used in figure 15, in order create again as many intersections possible between the two graphs.
![Figure 16: Correlation between sun & temperature = +0.98 [p=0.000] for the period 1867-2017; based on average values during a magnetic solar cycle that starts and ends at a solar minimum year - where the BSI is based on the average value of the situation with- and without a phase correction.](http://klimaatcyclus.nl/klimaat/pics/climate-sensitivity-is-low-background-solar-irradiance-and-temperature-show-similar-curve.jpg)
Figure 16: Correlation between sun & temperature = +0.98 [p=0.000] for the period 1867-2017; based on average values during a magnetic solar cycle that starts and ends at a solar minimum year - where the BSI is based on the average value of the situation with- and without a phase correction. The last values displayed for the year 1879 relate to the magnetic solar cycle that starts at the minimum year 1867 and ends at the minimum year 1890.
{VII-14} In figure 16 the BSI shows an even greater correspondence with temperature and the correlation has risen to +0.98 [p=0.000]; this correlation is a fraction higher than the correlation between CO2 and temperature. The number of intersections between the two graphs is 8 (the same amount found in figure 15). 1986-2012 in particular shows a remarkably long period in which the graphs show a large overlapping. Further analysis shows that the BSI exhibits a higher increase compared to the majority of points for temperature. It appears, again, that the dynamics inside the BSI graph are clearly larger than in the temperature graph, illustrated by the presence of relatively steep slopes. Another remarkable aspect is the fact that the momentum leading to the last point (2012) is weaker for the temperature than for the BSI and the CO2.
{VII-15} And as a final step, a 2nd analysis is made for the average with- and without phase correction based on the 2 last points in the BSI curves of figure 13. For that case the correlation for BSI & HadCRUT4 arrives at a value of +0.974 and the correlation between the BSI and the CO2 arrives at a value of +0.913; both values do not differ much from the correlations shown in figure 16. This analysis is also included in the Excel data file.
{VII-16} Coincidentally, the final BSI point in figure 16 is located in between the temperature and the CO2. It can be noticed here that the very high correlation between the sun and CO2 also represents a factor which suggests that the recent 'records' in the solar activity likely play a significant role in the CO2 growth.
{VII-17}
An important point in figure 16 involves the ratio between the scales, which suggests that a variation of 0.1 W/m2 in background solar irradiance corresponds with a temperature difference of approximately 0.21°C. Wikipedia reports a value of +0.18 C (almost 0.2°C) per 0.1% variation in the TSI, which results in a value of approximately 0.13-0.15°C; per 1 W/m2.
By the way, Shaviv describes based on the Ocean Heat Content a value of approximately 0.1°C per 1 W/m2. Data from NASA shows that the temperature increase of ocean surface water in the last 140 years has been rising 2 to 3 times more slowly than temperature on land. And experts recognize the increase in Ocean Heat Content to represent a more reliable indicator for 'global warming' than the temperature rise in the atmosphere.
From this can be deduced that with regard to the BSI a reinforcing factor with a value of 14 to 16 is required, which corresponds to a value of 8.75 to 10 with regard to the TSI (the mutual ratio amounts to 8:5; for, the variation in the TSI is larger in size, which explains why the TSI requires a smaller amplification factor than the BSI). Shaviv describes a reinforcing value of just 5 to 7 for the TSI based on the impact of the solar cycle only24. On the one hand, this migh mean that the temperature impact of small variations in the sun is also underestimated in Shaviv's work. Given the combination of the very high correlation + the high number of intersections between the curves, it is not likely that the BSI scale in figure 16 is made too large relative to the temperature, because it would require a very large adjustment of approximately 25-43% (these percentages refer to the difference between the bandwidth for the amplification value described by Shaviv and the bandwidth of 8.75-10 just described for the TSI). Even when the largest adjustment is used, at least about 67.5% of the warming since 1976 can still be explained by the sun; a percentage of at least about 57% is found for the period since 1867.
{VII-18} The particularly strong correlation combined with the associated oscillation suggests that account must be taken for the possibility that climate sensitivity is lower than the value 1.5°C (= the lower limit used by the IPCC) and also lower than 1.0°C. In the discussion, a comparison based on 3 different perspectives describes a climate sensitivity value in the order of maximum ~0.49°C - which implies a high 'solar sensitivity'. This indicates that the climate on earth is very sensitive to small fluctuations in solar output due to a high amplifying factor - where 3 factors can become involved: (1) more solar magnetism results in less cosmic radiation, which results in fewer clouds; (2) increase in UV radiation has an impact for: ozone, troposphere gases, aerosols & clouds; (3) changes in solar wind affect the cloud system. The discussion will also exhibit that estimates for climate sensitivity in a sample of 41 studies based on instrumental data in no less than 4 cases (= almost 10%) results in a value of 1.0 or lower. The result of this research is therefore in no way contrary to earlier estimates based on instrumental data.
{VII-19} Further investigation has to show to what extent the correction of the TSI used based on the sunspots can be validated and possibly improved. The most obvious objective is to strive for a more stable BSI than is visible in figure 3. The result found is a strong indication that the design to filter out various forms of 'noise' has succeeded through choices made based on the characteristics of the 22-year magnetic solar cycle. The impact of the sunspot cycle has been reduced to a large extent, but it has still remained clearly visible in the BSI. There is plenty of space for improvement and then a repeat of the steps described can follow to describe the impact of an adjustment.
VIII - Climate definition is outdated
{VIII-1} The traditional definition for climate suggests that natural fluctuations relate to average temperature, humidity, air pressure, wind, cloud cover and precipitation over a period of at least 30 years25. In the scientific literature is being recognized since 2004 that an extension in the definition for the climate from "at least 30 years" to "at least 50 years" is necessary based on natural variability26. Since at least 2012, Dutch researchers from KNMI have notified that the 30-year period is too short for studying weather extremes in the context of climate change27,28.
{VIII-2} In August 2019 article is described that the 66-year cycle provides as well an argument to conclude that the 30-year period mentioned in the climate definition is clearly too short because natural variability can easily become mistakenly recognized for 'climate change' due to human activities. In August, a 0.12°C order amplitude was described for the 66-year cycle; however, the previous paragraph shows that on the basis of equal conditions in the solar cycle the amplitude of the 66-year cycle appears to be considerably larger. The average of the 3 minimum years of the solar cycle produce a value that is almost twice as large as was assumed in the augustus article: up to more than 0.22°C. This indicates that the sun plays a key role in the development of natural variability.
{VIII-3}
A second issue with importance concerns an aspect that is also discussed in the previous article; the 66-year cycle had to be corrected in the August analysis because it becomes manifest on a slope. The slope was described in August to have a value of +0.033°C per decade; a more precise calculation has been made later indicating that the slope is +0.026°C per decade (based on the period 1850-1952).
In August the analysis did not take into account the possibility that the sun is primarily responsible for the emergence of the upward trend channel. In the previous paragraph has been demonstrated on the basis of both the HadCRUT4 temperature series and the PAGES 2k temperature proxies that between the 2nd decade of the 19th century and the 1st decade of the 20th century, the sun is most likely responsible for an average increase of approximately + 0.023°C per decade. When these data are combined with each other, it can be deduced that between 1812 and 1952 the sun probably caused an average temperature rise close to +0.025°C per decade; this implies a temperature increase of +0.35°C over a period of 140 years. This pattern is consistent with the passage in the 1997 KNMI lecture which describes and acknowledges that up to the 1940s the sun is accountable for the temperature rise.
{VIII-4} The present analysis shows that based on the combination of a multi-decade cycle (with a length of 66 years = 6 solar cycles) and an upward trend channel, the activity of the sun explains not only the temperature development between the 1940s and 1970s, it explains the temperature developement between the 1970s and 2010s as well. In addition the BSI points out for the individual years the year 2015 forms probably the end point of the upward phase of the multidecadal cycle, which is 5 year later compared to the estimate that is made in the August analysis - which was solely based on the temperature trend in the past. The climate change that has been observed in recent decades can therefore potentially be attributed to natural variability entirely. The 21st century shows for the BSI an acceleration in the upward-looking trend which can be attributed directly to the upward phase of the Gleissberg cycle; during the 2010s a prolonged accumulation of solar radiation became manifest on an unusual high level. Figure 5 (paragraph IV) shows that in the BSI perspective prior to the 21st century, the period from 1850 does not show any periode longer than 5 years in a row with a value higher than 1361.1 W/m2. However, starting from the super El Nino of 1998 a period of 6 years in a row emerged beyond this level of activity; since 2010 the annual BSI value has been higher than this level every year resulting in a period of 10 years in a row.
{VIII-5} This implies that the observed climate change is most likely mainly the result of natural variability due to a particularly high solar activity which unexpectedly sustained for a prolonged period during the upward phase of the Gleissberg cycle until the year 2015. In this perspective it is remarkable to notify that in the last full climate report (IPCC AR5, 2013) there is no direct reference made to the sun in any title of it's chapters and paragraphs31. The influence of the sun is structurally underestimated by the IPCC. Moreover, it seems that the role of the sun in the reports of the IPCC is being downplayed structurally. The IPCC AR5 report describes the sun's influence in terms of 'magnetic flux', but the sun's 22-year magnetic cycle is never mentioned.
IX - Discussion & conclusion
{IX-1}
This study uses the LISIRD TSI presented by the Laboratory for Atmospheric and Space Physics (LASP) at the University of Colorado Boulder - the world leader in
space-based research, including measurements of the Sun. LASP is covering the solar spectrum from 1 to 2400 nm. No single instrument can measure the solar spectral irradiance from X-rays to the IR; however, the ensemble of LASP instruments can do this. LASP is also responsible for Solar Radiation and Climate Experiment (SORCE), a NASA-sponsored satellite mission that measures incoming X-ray, ultraviolet, visible, near-infrared, and total solar radiation.
According the compilers the LISIRD TSI incorporates the most realistic and current estimates for solar variability over the past 400 years. This implies that the LISIRD TSI contains important corrections that became subject of consensus over time (the compilers present a list including 78 solar datasets which has been taken into consideration in the compilation of the LISIRD TSI).
Prior to this study a very relevant correction was made in 2014 with regard to the "minimum-to-minimum trends during solar cycles 21-23 "; this correction implies that the influence of the sun appears to have been marginally greater in the last decades of the 20th century than has been assumed in CMIP models in the 2010-2014 period.
In 2016, the LISIRD authors also described the LISIRD TSI to be consistent29 with Wang's data set (2005)30, which is featured prominently with 2 data sets (with and without 'background') in the TSI reconstruction that the IPCC has presented in its AR5 report31 in the year 2013. This explains much of the variations between the LISIRD TSI and other (outdated) data sets (or raw TSI data); in most cases these differences can likely be attributed to the missing of corrections in the other data sets.
{IX-2} Wang's work describes a TSI graph for the period 1716-1996 with a curve which shows that since the 1960s the sun's activity has increased at the maxima during the 2nd half of the 20th century. It is strange to see that this upward trend is missing in the presentation by the IPCC for Wang's reconstruction, see figure 17. However, in the IPCC version of Wang with 'background' a pattern is shown in which the minima have continued to rise and reach a record level in the 21st century. The IPCC version of the data presented by Wang, also includes a 2008 reassessment where the consensus TSI value has been adjusted from 1365.4 W/m2 to 1360.9 W/m2 - this correction implies that the minimum TSI value is 4.5 W/m2 lower than previously assumed.
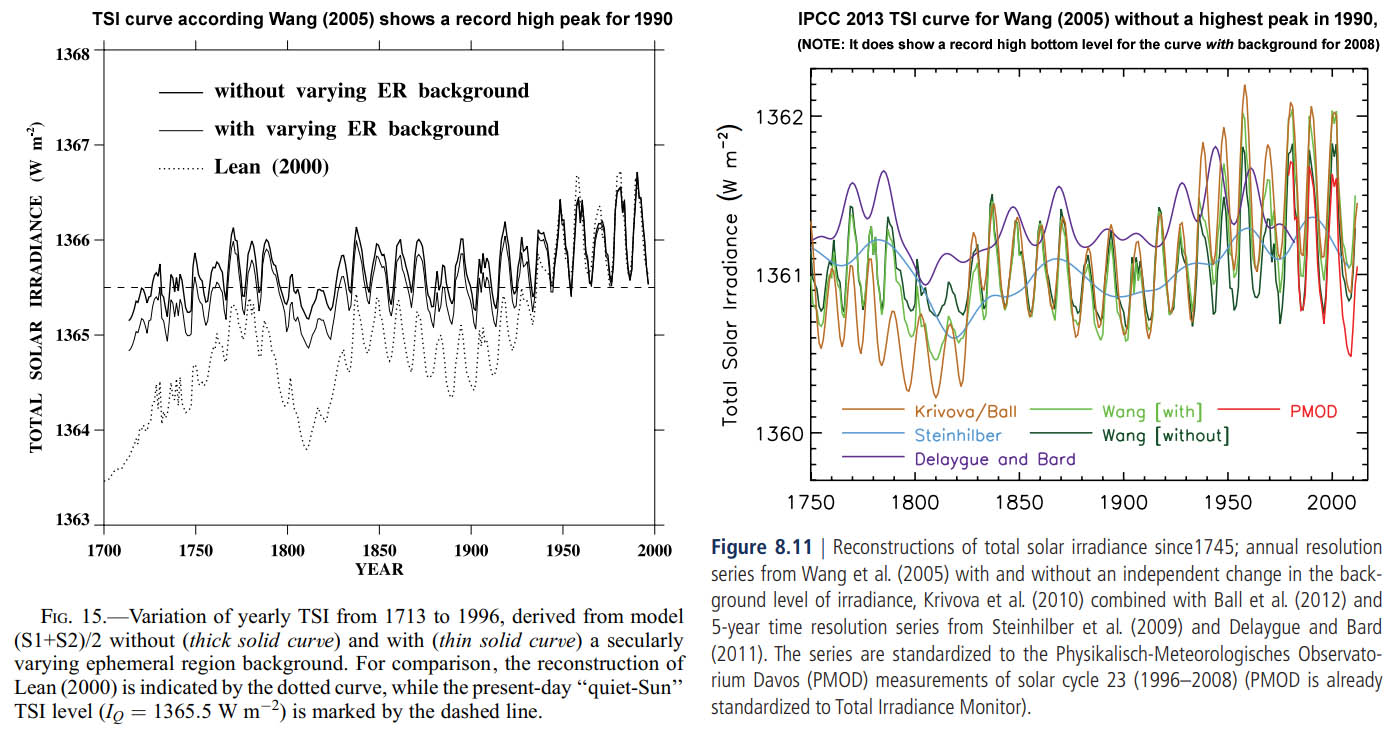
Figure 17: TSI according Wang (2005) + the IPCC AR5 (2013) version of Wang's data.
{IX-3} The LISIRD TSI data set includes all major corrections, including the 2008 and 2014 corrections which have been mentioned above; the data set is described by the authors as follows:
Description - This historical TSI reconstruction is an "unofficial" series using corrections that are believed to reflect the most realistic and up-to-date estimates of solar variability over the last 400 years, such as the recent revisions to sunspot number records.
{IX-4} Figure 18 presents a description for fluctuations in 4 different wavelengths included in the LISIRD TSI data set29. Figure 18 shows that the variability in the spectrum of UV light (which contains a shorter wavelength than visual light) is relatively large: in the order of ~10%; however, UV light covers approximately only 0.01% of the total TSI.
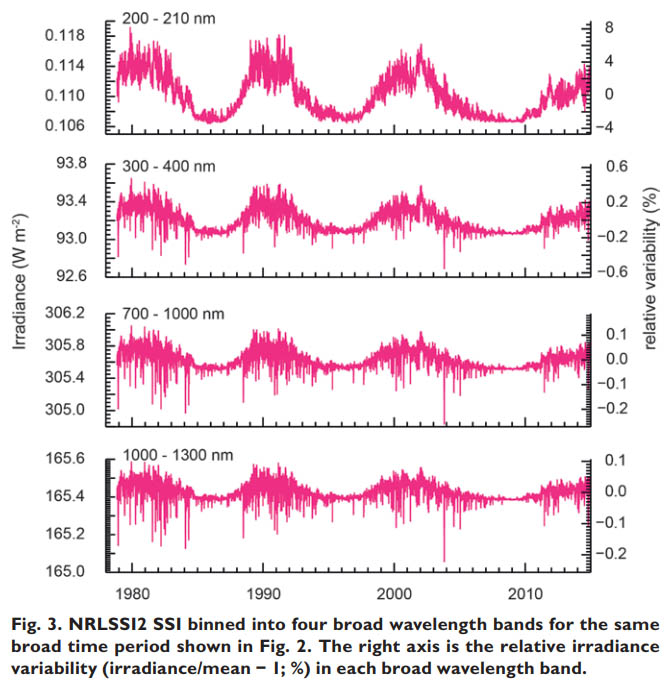
Figure 18: Solar cycle fluctuations for 4 different wavelengths included in the LISIRD TSI data set.
{IX-5}
Paragraph II describes the physical mechanism that is responsible for the impact difference between minima and maxima. This mechanism applies to both the frequency, the amplitude and the number of active regions of the solar output. The minimum years are associated with low frequency pressure waves featured with a high amplitude, while maximum years are associated with high frequency pressure waves featured with a low amplitude. Also, sunspots are known to produce a decrease in the output of visible light (= low frequency light) combined with an increase in the output of UV light (= high frequency light) - see figure 19.
Low-frequency light with a high amplitude logically penetrates deeper into the earth's atmosphere than high-frequency light with a low amplitude. On the one hand, this provides an explanation for the high correlation between the rising minima in the solar cycle and the temperature rise in the lower atmosphere of the earth. On the other hand, the stratosphere of the earth has cooled since 1979; this period coincides with a pattern of falling maxima in the solar cycle (only around the turn of the century there were higher maxima compared to 1979). The described mechanism of physicsseems to provide a potential (partial) explanation for the opposing trends between, on the one hand, the temperature development in the higher and lower atmosphere ofearth and, on the other hand, the falling maxima and rising minima in solar output. Because degradation of the ozone layer [O3] takes place under the influence of UV light, UV might also play a key role in this perspective.
Degradation of the ozone layer can be accompanied with a delivery of oxygen [O] taken from the higher atmosphere, which can play a role in the creation of more carbon dioxide [CO2] in the lower atmosphere. The theory which describes that CO2 is responsible for cooling the stratosphere, can also be refuted with the aforementioned mechanism of physicals - especially since it has long been clear that ozone-depleting substances (such as CFCs) are responsible for this and not greenhouse gases (such as CO2). The increase in UV solar radiation has contributed to the demolition of the ozone layer - which belongs to the central part of the stratosphere. The solar cycle has also putten a delaying effect on the recovery of the ozone layer. The thickness of the ozone layer shows a proportional relationship with the temperature of the ozone layer (read: the temperature of the stratosphere); moreover, the thickness of the ozone layer depends on the solar cycle. The physical mechanism potentially offers a part of the explanation for the missing of the so-called 'hot spot' in the tropical troposphere. Moreover, also the thermosphere is being reported to show a temperature drop mainly due to ozone degradation; the influence of greenhouse gases on cooling is not detectable according researchers. In addition, for the thermosphere is UV radiation from the sun the dominant factor when geomagnetic activity (generated by the earth itself) is at a low level.
Figure 19: NASA description for the influence of the solar cycle on various parts of the solar radiation spectrum; on the left: extremely low UV, on the middle: high UV, and on the right: visible light.
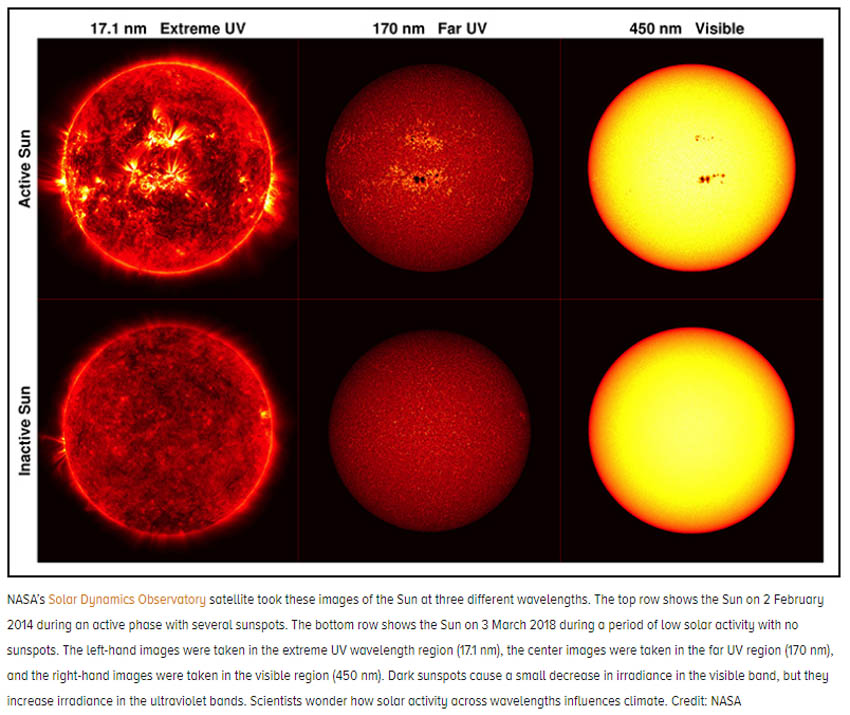
{IX-6} Part of the misunderstood relationship between the activity of the sun and the temperature development on earth relates to the following. Where the variation in the TSI cycle based on the entire spectrum is in the order of 0.1% of the total output, a much larger difference is found with regard to the output of the UV radiation (see Figure 18) - the percentage can exceed 10%29. There are indirect indications based on algae proxies32 which show that the amount of UV radiation has reached in the 21st century a rather unusual high level. This also explains why UV (in addition to the influence of cosmic radiation) is recognized as one of the possible factors that can play a role in the amplifying mechanism for the relatively small fluctuations of the sun13. The other 2 candidates that serve for this are, on the one hand, the dynamics involved with less influence of cosmic radiation (due to higher solar activity) and, on the other hand, the influence of solar wind - which is accompanied by complex variations in solar output. This implies: the TSI does not provide an overall picture for solar activity. The authors of the LISIRD TSI use the following formula for TSI variations over time (Q = basic level, F = solar faculae, S = sunspots)29:
T(t) = TQ + △TF(t) + △TS(t)
{IX-7} This formula also provides a basis for the logics used in this study for how the "background solar radiation" [BSI] is calculated; after all, the BSI can be recognized to represent a factor that theoretically approximates the combination of the TQ and △TF(t).
{IX-8}
The analysis in this article shows that after corrections (where the influence of sunspots is largely removed combined with a phase correction), the BSI shows a very high correlation with temperature: r = 0.98 [p=0.000]. The correlation between CO2 and temperature is of a similar high magnitude: +0.97 [p=0.000]; however, the correlation between solar irradiance and CO2 is also particularly high with a magnitude of +0.93 [p=0.000]. Especially figure 6, figure 13 and figure 16 are illustrative for the past 150 years where the sun shows a dynamic featured with an oscillation that corresponds to a large extent to the temperature development. Also in the last few decades a clear parallel is found between both factors, leaving little space for the influence of CO2. The high correlation combined with the corresponding oscillation basically explains the full temperature variation; both perspectives also show a clear parallel in the form of record high levels. Finally, the falling trend at the TSI maximums in the recent decades shows a parallel with the stratospheric temperature drop.
Section VII describes that the increase in solar activity also played a (limited) role in the increase in CO2. For, the warming of the ocean system has since 1850 contributed about 15% to the increase in CO2. It is possible that the sun indirectly also played a greater role in the rise in CO2 via other phenomena (such as UV and/or solar wind), but it appears that little is known about this potential option.
However, it is known that the influence of CO2 on temperature was very limited until 1940 at least. The impact can likely only have become more apparent starting from the 1980s/1990s. Therefore, the correlational relationship between CO2 and temperature over the period 1850 to 1980 can largely be described to include/represent a spurious correlation that has primarily arisen under the influence of the growth of the world population - the latter factor is probably the basis for the 'unprecedented' rise in CO2 and other greenhouse gases since the start of the industrial revolution.
{IX-9} Fundamentally, the entire chain of cause and effect can be described as follows:
1) Since the Maunder minimum, the increase in solar activity has caused a temperature rise on earth of almost 1.5°C and an increase of approximately 20 ppm CO2 (= ~14.7% of the total CO2 growth).
2) The combination of the temperature increase and more CO2 has had a positive influence on the 2 major food categories consumed by humans, which results in: more vegetable based foods (via the greening of the earth) and more animal based foods.
3) The increase in solar activity has therefore also played a role in world population growth. Through technology, which can include agriculture and animal husbandry (in a broad context), food is now produced in a more efficient manner. It is also known that the growth of agriculture and animal husbandry plays an important role in the increase of greenhouse gases, of which the compound molecules carbon dioxide [CO2], methane [NH4] and nitrogen dioxide [N2O] are most well known.
This research has implicit shown why the influence of CO2 on temperature can still not be demonstrated based on empirical data in the climate system. The influence of natural variability in the form an oscillation combined with an upward trend that has resulted in various recent solar records, explains potentially the development of the temperature entirely. Moreover, all known natural cycles (day/night cycle, seasonal cycle & ice age cycle) show that CO2 follows the temperature, and not the other way around.
{IX-10} In paragraph III figure 2 describes that in the perspective of the TSI minimum years the sun can be taken accountable for at least 75% to 95% of the temperature rise. Section VII describes on the basis of the average values during a magnetic cycle that the upper limit may reach a 100%; however, the calculation method used here shows a less accurate picture with respect to the phase correction for the period starting from 1996. The various records during the 2010s for both the TSI and the BSI confirm that in recent decades there have been conditions at the sun associated with an exceptionally high magnetic activity. This is also confirmed for the perspective of sunspots, which occur due to the toroidal magnetic component. For sunspots can even be said that the recent circumstances at the sun can be called exceptional in the perspective of the past 8,000 years.
{IX-11}
In terms of the radiation forcing, Shaviv24 describes an amplification factor for TSI fluctuations of a factor 5 to 7. The implication of a large impact of the sun is summarized by Shaviv in a recent VIDEO presentation (April 2018), where approximately "half to two thirds" of the temperature rise in the 20th century is attributed to the sun; the climate sensitivity is therefore estimated at a value between 1.5°C and 1.0°C respectively. This explains why the IPCC has continued to describe a bandwidth with a lower limit of 1.5°C; because a lower value would implicate that the impact of natural variability could be higher than 50%.
The LISIRD TSI shows an average increase of approximately 1 W/m2 since the Maunder minimum; an amplification factor of 8.75 to 10 (see section VI) produces an impact that represents a value of 8.75 to 10 W/m2. The magnitude of the amplification factor is higher for the BSI with a magnitude of 8/5 of the TSI values; for the BSI this results in an impact value of 14 to 16 W/m2. The size of these numbers may seem large at first glance, but it is for example almost a factor 10 lower than the amplification factor required for a significant impact of UV fluctuations (which play a significant role in the much larger cooling of the stratosphere - relative to the warming of the lower atmosphere).
For CO2, the starting point is that the radiative forcing based on a doubling of CO2 is in the order of 3.7 W/m2. Since 1650, CO2 has risen from around 276 ppm to an average of around 412 ppm in 2019, which corresponds to an increase of almost 49.3%; this results in a radiation forcing of almost 1.82 W/m2. This value represents 11.4% to at most 13.0% of the impact of the BSI. In the perspective of the TSI, the combination including the amplification factor results for CO2 in an impact of 18.2% to 20.8%. Based on the amplification factor for the perspective of the BSI, it can be concluded that the sun is responsible for more than 87% to 88.6% of the warming since the Maunder minimum. Also, a percentage with a bandwidth between more than 75% and 95% is described in section III on the basis of the minimum years, and section VI describes a bandwidth with a lower limit of 57% (based on a less realistic assumption) and an upper limit of 100%. The combination of these 3 perspectives produce an overlapping bandwidth where the percentage for the influence of the sun can vary between 87% and 88.6%. For the period from 1650 this leaves space - based on a stable strengthening factor in the BSI - for a climate sensitivity with an average value of approximately a maximum of 0.39°C (this concerns the upper limit of the bandwidth of 0.39°C to 0.34°C derived from the percentages mentioned). The midpoint of the 3 described bandwidths (~83,8%) results in an average value for the climate sensitivity that is approximately 0.1°C higher: maximum ~0.49°C. The term 'maximum' is used here because in addition to the influence of the sun and CO2 potential other factors can play a role in this as well - such as the impact of cleaner air and other greenhouse gases.
{IX-12} In an overview of 142 climate sensitivity studies are 2 studies included which report a climate sensitivity value below 0.5°C. Interestingly, one of those 2 studies is presented by Specht et al. (2016)33 who report a climate sensitivity of 0.4°C based on a mathematical model that focuses on just thermodynamics combined with clouds (the sun plays no role in this model). Additionally, it can be stated that based on research that focuses on the emission spectrum of CO2 combined with the annual cloud cover, an even lower climate sensitivity has been found: maximum 0.2°C (van den Beemt, 2019).
{IX-13} If the reinforcing factor for the influence of the sun is not taken into account, the impression is created that based on theoretical grounds the influence of CO2 is relatively large. Based on a very strong correlation between the BSI and temperature, which are both accompanied by a corresponding dynamic in the form of a similar oscillation on top of a positive trend combined with recent records, the conclusion is that it is not realistic to disregard a (substantial) reinforcing factor representative of the impact of the sun.
{IX-14} The introduction text of this article refers to a description presented by the Max Planck Institute (2004)3 which shows that solar activity has reached record levels over the past few decades in a perspective which covers 8,000 years. The two graphs shown below for illustration are based on isotopes used as a proxy for solar activity; both graphs show a course with the shape of a 'hockey stick'.
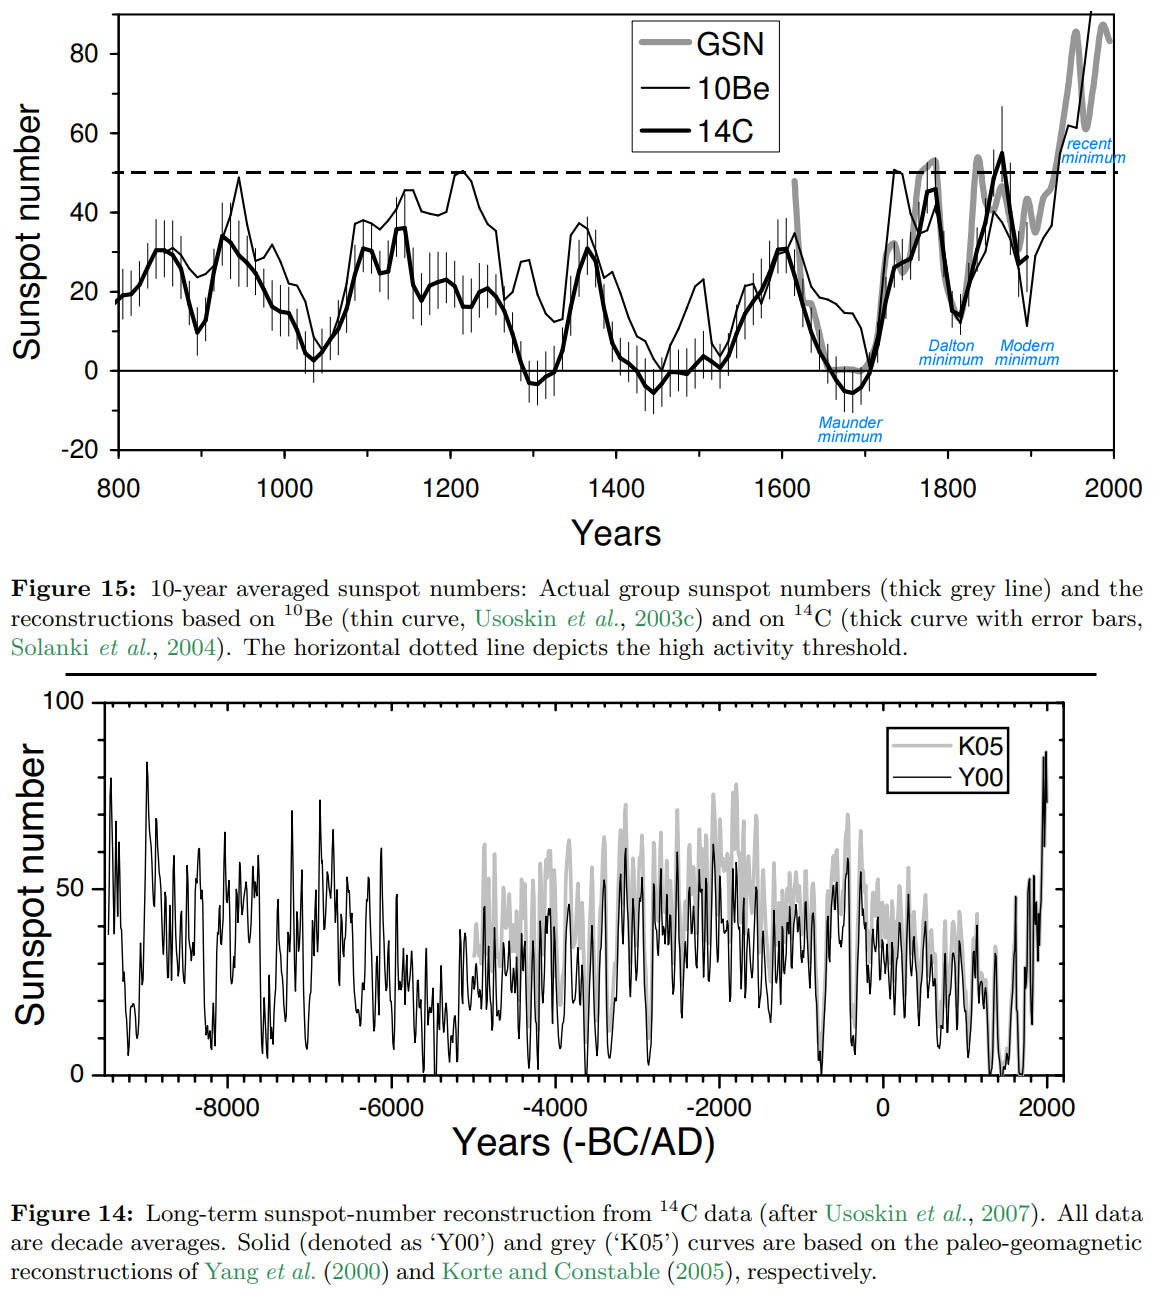
Figure 20: Sunspot proxies show graphs with the shape of a 'hockeystick'34.
{IX-15} In figure 20 the top graph above the dotted line shows that sunspots have been highly active since 1930; in the 19th and 18th centuries a level of likewise high activity never lasted for more than 2 decades in a row. Figure 11 shows a similar pattern of dynamics; the major difference is that the TSI shows a high activity in the 19th century for a continuous period of 50 years. Based on the LISIRD TSI, this period can be determined precisely: 1826-1876 (for the BSI this involves almost the same period: 1827-1876). This explains why the decrease in solar activity in the period between the 1950s and the 1970s had relatively little impact on temperature. Despite the substantial decrease observed in the maximum years, the decrease in the minimum years has been limited; it maintained at a level well above 1360.75 W/m2. The temperature fall between 1944 and 1976 may have been caused with a partical contribution by the ocean system; internal cycles may have played a significant role. Due to enduring high solar activity the downward temperature pressure remained limited. The PAGES 2k proxies do not show a dynamic in figure 11 which suggests that cooling during the end of the 19th century and the beginning of the 20th century had more impact than cooling during the 2nd half of the 20th century. Possibly, the impact of the cooling in instrumental measurements based on the HadCRUT4 between 1878 and 1911 is somewhat overestimated with a temperature drop of no less than -0.58°C. For example, between 1880 and 1911 there is a temperature difference of only -0.32C (not much more than half of -0.58°C). The year 1878 can be recognized at the HadCRUT4 temperature range as the year which shows the largest deviating value compared to the surrounding years. The GISSTEMP v4 used by NASA shows a temperature difference of -0.41°C between 1881 and 1909, while between 1944 and 1964 shows a difference with a similar size of: -0.40°C. In short, at this point the PAGES 2k proxies display a dynamic that is more consistent with the GISSTEMP v4 than with the HadCRUT4. This suggests that the temperature measurements prior to 1880 may be less reliable - though the HadCRUT4 for the period prior to 1880 does show a dynamic that is slightly more in agreement with the sun than is the case with the PAGES 2k proxies.
{IX-16} A comparison between both sunspot proxies shown in figure 20 and the PAGES 2k proxies for the period 800-2000 in figure 21 (which is based on raw temperature proxies) shows a clear parallel: both the sunspot proxies and the temperature proxies show a graph in the shape of a 'hockey stick' with the blade sticking out above the handle. A relevant aspect is that in all three graphs the lowest point is found just before the year 1700. Moreover, the blade of the hockey stick protrudes relatively far above the handle for the sunspot proxies; the tip of the hockey stick is more than 2x higher than the bandwidth in the period between the year 800 and the year 1700. However, figure 21 does include an optical distortion - because only this graph shows an image based on individual years. Nevertheless, a closer examination of the graph makes it clear that the hockey stick endpoint based on the 10-year temperature average is not much more than a quarter higher relative to the bandwidth in the period 800-1700. This pattern of dyanmics is confirmed even more clear by the PAGES 2k proxies for the period 0-2000.
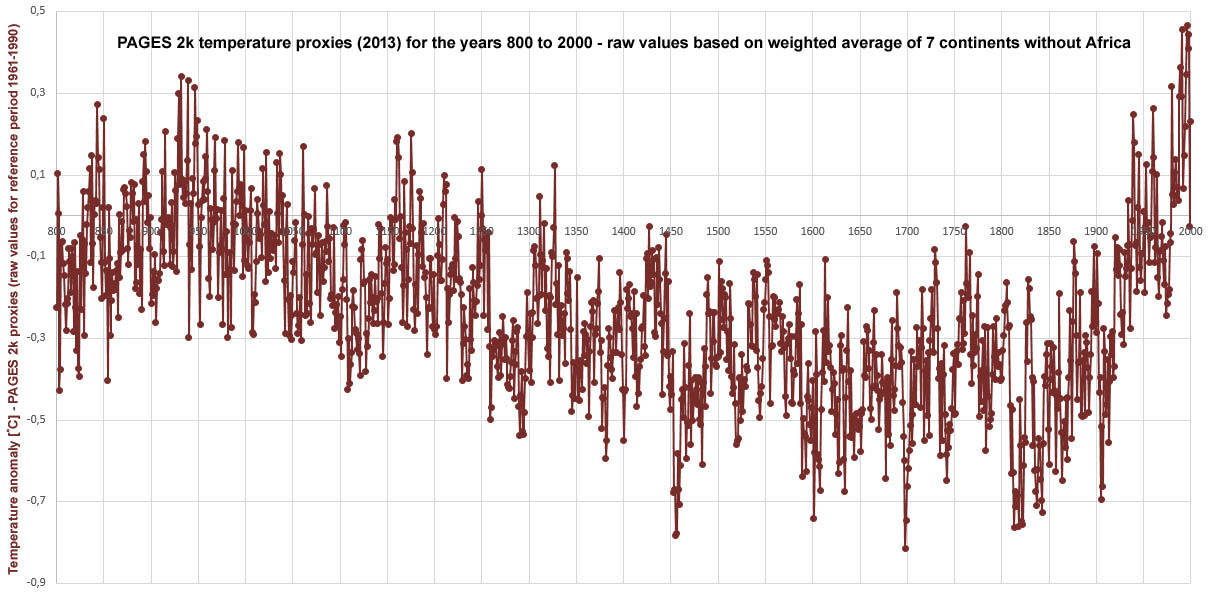
Figure 21: PAGES 2k proxies (2013) based on raw temperature anomaly values - derived from the weighted average over 7 continents (including the North Pole, only the continent of Africa is missing because of a lack of data17). The graph for the period from the year 0 to 2000 is available HERE.
{IX-17} The graphs for sunspots and temperature show for the period between the year 800 and 2000 a dip in 3 periods after the year 1700: at around 1820 (= Dalton minimum), just after 1900 (= modern minimum) and around 1965 (= recent minimum). This reveals a clear parallel with the bottom phases of the 66-year cycle in the HadCRUT4 temperature series at the years 1911 and 1976. Based on sunspots, the combination of figure 19 and figure 20 leaves not much space for doubt about the determining role of the increased solar activity in the rise of temperature since the 2nd half of the 17th century starting from the Maunder minimum. The HadCET temperature graph for Central England (see red line in figure 8) also indicates through the multi-year average based on instrumental measurements that the speed of the temperature rise in the decades after the Maunder minimum was significantly higher than the trend for the period after 1976.
{IX-18} Figure 22 shows that the multi-decadal cycle is also clearly visible for the perspective of monthly values in all global temperature series. Combining the HadCRUT4 and the PAGES 2k proxies, it is possible to conclude that the multi-decadal cycle manifests in both the HadCRUT4, the GISSTEMP (NASA) and the GHCN (NOAA) on top of a stable upward slope35. There is no solid indication to question the existence of the 66-year cycle. This research has established that the 66-year cycle is associated with a similar oscillating movement in solar activity, which in the TSI mainly becomes manifests in the perspective of the minima.
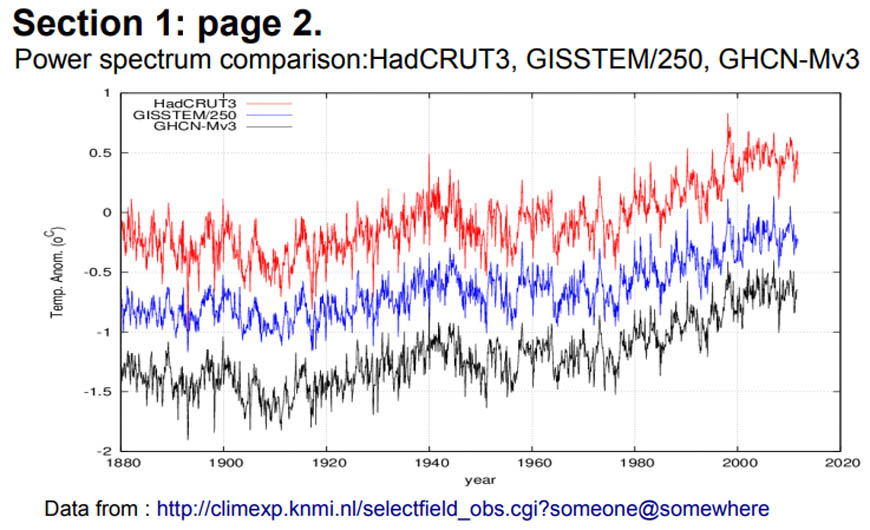
Figure 22: 1880-2011 KNMI climate explorer graphs for the monthly values of HadCRUT4, GISSTEMP (NASA) & GHCN (NOAA)35. Just for reference: at the HadCRUT4 monthly values the temperature anomaly of October 2019 is at an average value of +0.751°C; this is -0.012°C lower than the February 1998 value of +0.763°C. In the illustration above, all graphs peak in February 1998. The highest monthly value so far in the HadCRUT4 series is February 2016: +0.111°C. Between January 1850 and October 2019, a total of only 3 monthly values are higher than +1,000°C. This only happened during the last strong El Nino about 4 years ago during the months (from high to low): February 2016, March 2016 and November 2015.
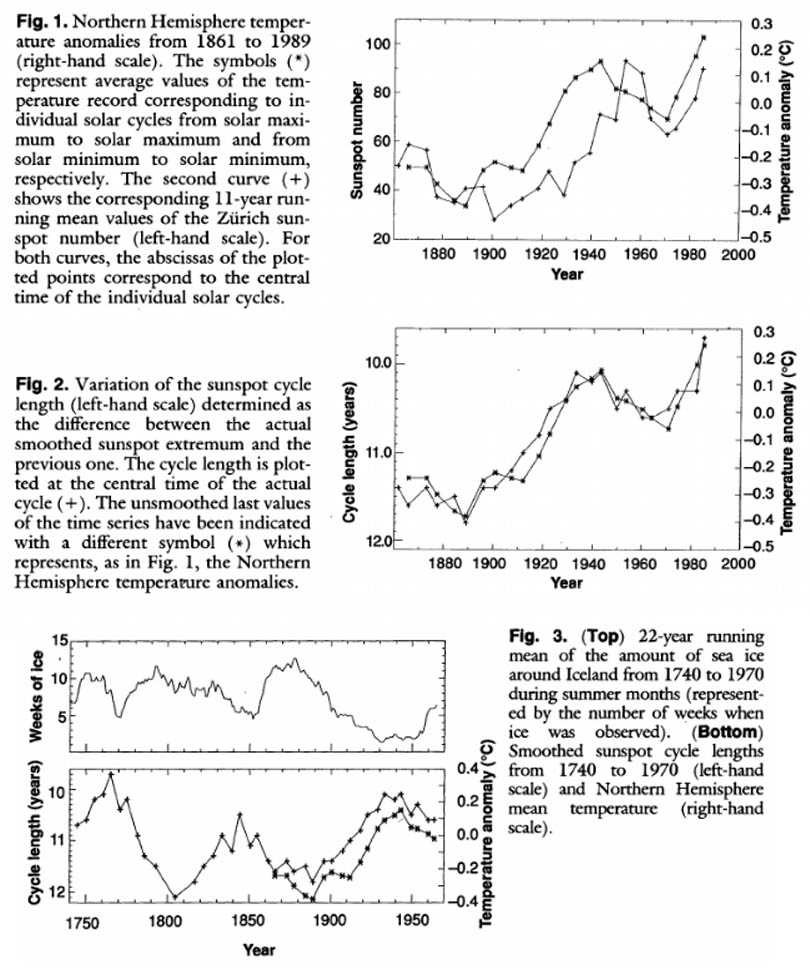
Figure 23: Temperature vs. the length of the sunspot cycle & the number of sunspots (1991)22.
{IX-19} The lecture on the Dutch KNMI website (see the introduction of this article), suggests that the Gleissberg cycle mainly relates to the length of the solar cycle. However, it was already clear in 1991 that a relationship with the temperature can also be described via sunspots numbers 22.36 . Figure 23 and figure 24 show some illustrations describing the relationship between the Gleissberg cycle and the multi-decadal cycle on Earth with the use of sunspots.
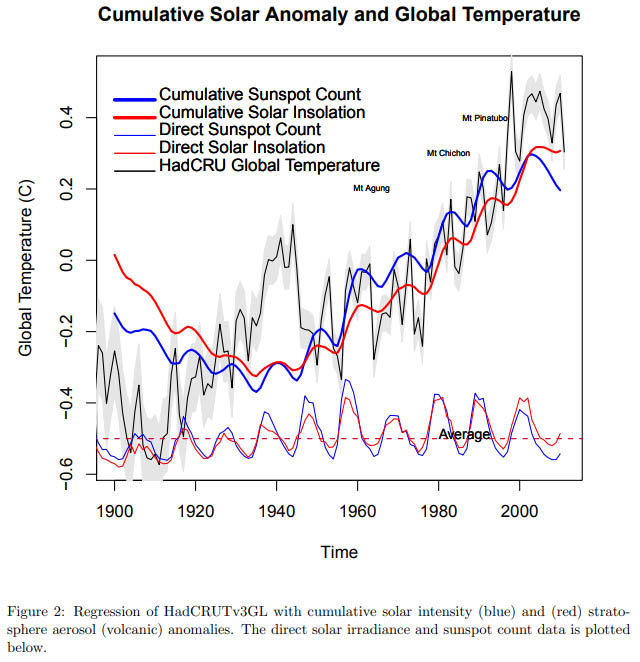
Figure 24: Temperature vs. cumulative sun anomaly (2011)36.
{IX-20} It is also important to note that the Gleissberg cycle is a cycle related to the sun; it is therefore by no means self-evident that the length of the Gleissberg cycle corresponds to the length of the multidecadal cycle in the global climate system. Nevertheless, it has been established in paragraph VI that a clear pattern is present in the course of development of the minima in the LISIRD TSI for the period starting from 1890. A sequence of 3 upward directed minima is followed by 3 downward directed minima; then this pattern repeated up to and including the 2nd half of the 2010s. Based on this simple pattern, a downward-directed continuation under the influence of the Gleissberg cycle can be taken into account for the coming 3 solar cycles (this concerns the period up to and including 2050). After it has become clear in paragraph II that a high correlation with temperature development on earth can be expected (particularly with regarding the minima in the 11-year solar cycle), a downward temperature trend can be expected for the period up to and including 2050.
{IX-21} The expected negative temperature trend can also be read directly from figure 25. Figure 25 shows, among other things, that the cosmic orbit of the sun around the barycenter reaches in the year 2022 the highest point of the 21st century in multiple perspectives (both in speed and angular momentum). Moreover, Scafetta's illustration37 also shows that in the present decade the highest minimum phase in the velocity cycle has been reached and around 2030 the lowest phase will be reached. This means that in the coming decade will very likely generate much more clarity about the role of the sun in the development of temperature on planet Earth.
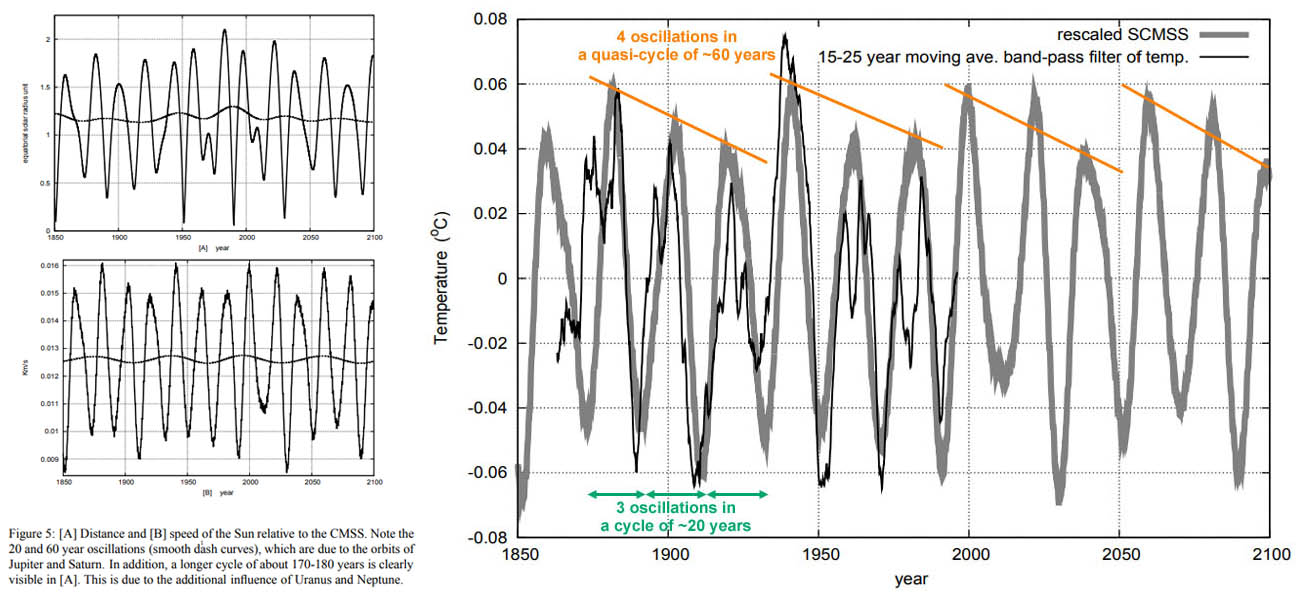
Figure 25: Multidecadal cycle in both speed and momentum/distance of the sun around the barycenter37.
{IX-22} In the scientific literature, the Gleissberg cycle is often described as a quasi-cycle because it is formed on top of the 11-year oscillation. For the exact duration of the Gleissberg cycle, descriptions are found in the scientific literature that vary from 65-130 years. One of the complications is the fact that in addition to the ~22-year magnetic cycle in the sun, a ~20-year cycle is also found which is related to the speed of the sun around the barycenter. Figure 20 shows on the left side in the small graphs the cosmic movement of the sun around the barycenter + how the distance/angular momentum (top) & speed (bottom) develop up to the year 2100. The large graph on the right side in figure 25 shows a very regular 60-year quasi-cycle at the maxima of the solar speed; this also provides a clear parallel with the evolution of the temperature on earth based on a 15-to-25 year moving average37. The length of this very stable 60-year cycle is a bit too short of duration to be associated with the Gleissberg cycle. The implication is that in addition to the 11-year solar (spot) cycle, the 22-year magnetic solar cycle and the Gleissberg cycle, other multi-decadal cycles with a slightly lower frequency also play a role in the sun. Appendix figure B1 shows a detailed impression involving the course of various of these cycles for the period starting from 1976.
{IX-23} History tells us that more than 400 years ago Johannes Kepler presented the very first descriptions for the influence of climate oscillations with a length of ~20 years and ~60 years38. Kepler described with his 'Trigon' that the conjunction between the planets Jupiter and Saturn arises every 19.86 years; this constellation is featured with different conjunctions in the movement around the sun occurring at an angle of 242.8° - see figure 26. Video 1 in the appendix shows that the outer planets Jupiter and Saturn (together with Uranus and Neptune) determine the orbit of the sun around the barycenter.
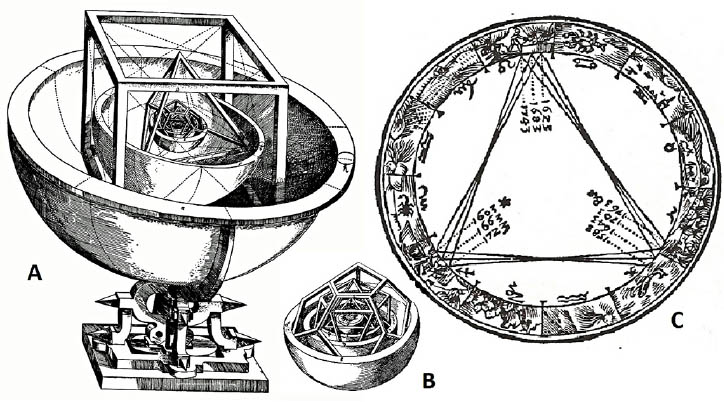
Figure 26: Kepler's trigon from 'De Stella Nova' (1606)38.
{IX-24} In this study it has become clear that when studying the relationship between solar activity and temperature on earth, the phase of 22-year magnetic solar cycle must be taken into account. In addition, account must also be taken of phase differences that may rise - due to for example: heat accumulation in the ocean system.37 The 66-year cycle in the Earth's climate system corresponds highly to the minimum years of the 11-year TSI solar cycle from 1890 onwards. Based on the average values during a magnetic solar cycle starting at the minima, a correlation of +0.98 [p=0.000] has been described for the period 1867-2017.
{IX-25} The bar can therefore be set high: climate models ought to be able to reproduce the 66-year cycle in the global climate system. Climate models which cannot reproduce the 66-year cycle, are basically underestimating both the influence of the sun and the influence of the upward phase of the 66-year cycle. Climate models which are incapable of doing so, can be expected to overestimate global warming for the decades to come - because these models do not take sufficient account of natural variability resulting from the downward phase in the Gleissberg cycle of the sun. Typical for such climate models is that a small weight is assigned to the sun in combination with a large weight for the influence of both greenhouse gases and aerosols. It is therefore logical that the compilers of such climate models will claim that they cannot explain global warming based on natural variability - however, such claims can primarily be recognized to represent the direct consequence of choices made by the makers in the construction of these models.
{IX-26} The influence of both the ENSO cycle (delayed ENS ONI) and aerosols on temperature in the stratosphere - due to, for example, volcanism (AOD) - has been taken in consideration in this study. The influence of both factors has not been included in the analysis involving the sun and temperature, in order to avoid unnecessary complications. However, both factors have little impact on the described correlations between temperature and the sun. The impact of the ENSO cycle has been described in paragraph V; AOD data is only featured in the Excel data file.
{IX-27} In the analysis of August 2019 the estimate is made that the peak phase of the 66-year cycle should manifest around the year 2010 - based on the assumption that a regular cycle is involved. In this article the 'background solar radiation' [BSI] shows that a solar activity peak has manifested in the year 2015 (see figure 3); this happened one year prior to the temperature record year 2016.

APPENDIX: 'How does the solar cycle work?'
{B-1} With the use of satellites, the magnetic activity of the sun has been closely monitored since 1978. The magnetic north- and south pole of the sun change polarity approximately every 11 years. This process develops synchronous for both poles (apart from small phase differences of a few months); it usually takes a few years before the change of polarity is completed at both poles.
{B-2} In figure B1 the black, blue and red graph are based on ground-based space telescope measurements (no satellite is involved) which already started in 1976; they show how the magnetic cycle of the sun has developed since may 1975. Just as an illustration for the phase difference between the magnetic cycle and the sunspot cycle (described in paragraph V), the yellow curve at the bottom of figure B1 shows the development of the TSI.
{B-3} Figure B1 also shows two other solar cycles which both relate to the movement of the sun around the center of gravity of the full solar system. These two curves show the speed & the angular momentum; both have an oscillation with a length of ~20 years. The video below figure B1 describes approximately the cosmic origin of the solar cycle and figure B2 describes the relationship between the sunspot cycle and the quasi-circular movements of the sun around the gravitycenter of our solar system (= barycenter).
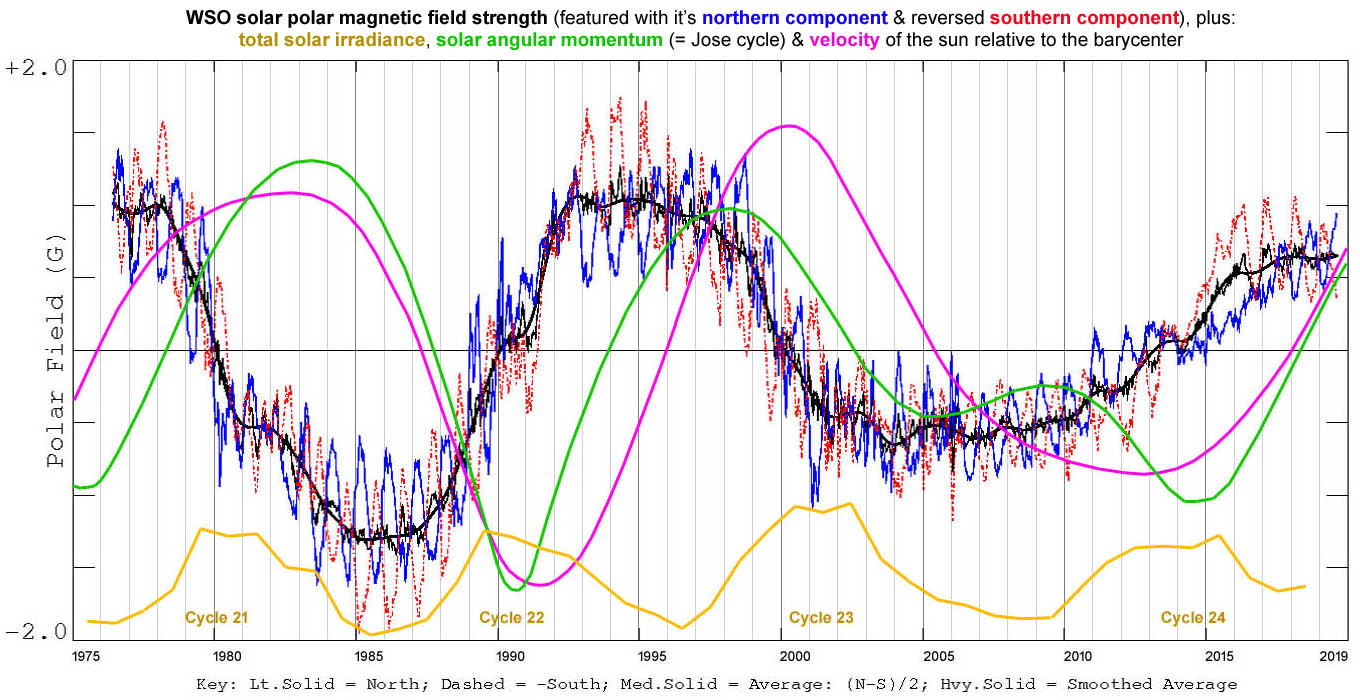
Figure B1: Development of the Sun's Magnetic Field Power (according WSO), plus: the total solar irradiance (LISIRD TSI), angular momentum (Jose cycle - McCracken) & speed (Scafetta, figure 7a) which both involve the movement of the sun around the barycenter.
VIDEO 1: The barycenter represents the mass center of our solar system; this video describes the movement of the sun around the center of gravity under the influence of the 4 largest planets (earth is located between jupiter and the sun).
Figure B2: The movement of the sun around the barycenter & the sunspot cycle (shown as a part of the TSI); the image shows the sun in a position which coincides with the barycenter (represented by the intersection of the two axes). The green, orange and red circular movements correspond to 3 specific sunspot cycles (= 3 half magnetic cycles).
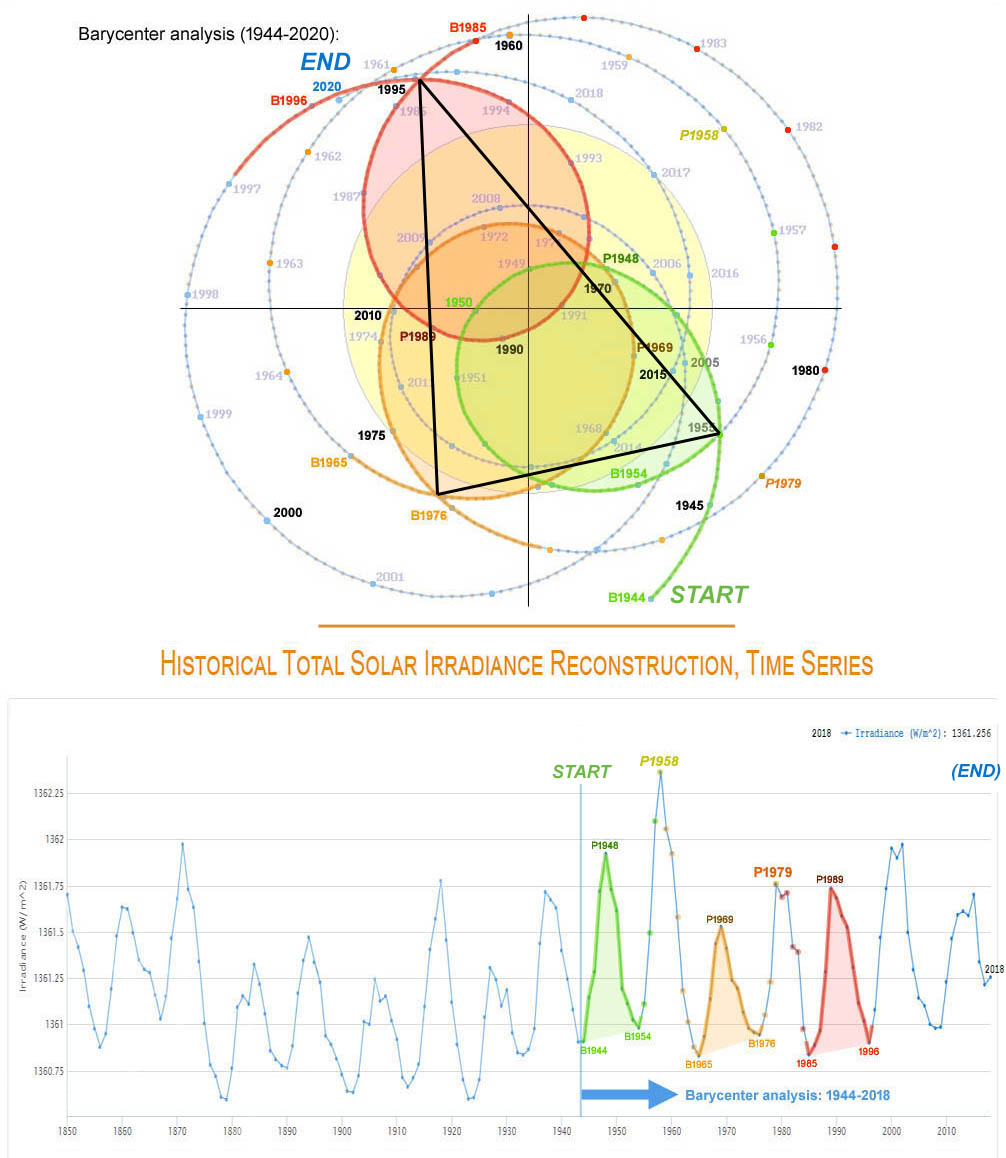
EXPLANATION for video 1 & figure B2 combined:
{B-4} The sun moves in small and large circular movements around the barycenter under the influence of the orbit & weight of the 4 outer planets: Jupiter, Saturn, Uranus & Neptune. Each individual movements takes by average approximately 20 years (this duration is approximately 2 years shorter than the length of the 22-year magnetic solar cycle). Usually this results in a combination of the following patterns: (1) first a small circle is formed while the sun is approaching the barycenter pretty close, (2) then about three-quarters of a large circle is formed when the sun is at a relatively large distance from the barycenter. After an average of approximately 60 years a movement has arisen which includes 3 of such combinations, where the small circles form an angle of approximately 60 degrees with respect to each other; the large circle parts together form an even larger quasi-shaped complete circle - the full perspective is described by figure B2.
{B-5} The exact cause of the length difference between the 22-year magnetic cycle and the 20-year movements of the sun around the barycenter is not fully understood. However, in 2016 scientists found an arithmetic basis for the possibility that this is probably a resonance effect due to the fact that the earth, venus and jupiter are positioned in line with the sun once every 11.07 yearsB1. This ensures that the magnetic field can make a change of polarity. This occurs during the high phase of the sunspot cycle, which goes parallel with the high phase of the total solar irradiance (TSI) cycle and the high phase of the toroidal magnetic component. The research results in paragraph II show that in particular the minimum phase of the 11-year solar cycle shows more or less the same development as the temperature development of the lower atmosphere on planet earth.
{B-6} Finally, the video below describes how the magnetic field develops during successive solar cycles. The horizontal magnetic field lines describe the development of the toroidal magnetic field; for this component a variation of pink and green cycles is shown on the left. The field lines at the poles show the poloidal magnetic field; for this component, a more or less opposing pattern of colors is found on the right-hand side, which describes the change in polarity at the poles.
VIDEO 2: The effect of the 22-year-old magnetic solar cycle in the perspective of the solar dynamo.

References:
1 - Klimaat brochure 'Klimaatverandering, Wetenschap en Debat' - Koninklijke Nederlandse Academie van Wetenschappen (2011).
2 - KNMI: Invloed variaties in zonneactiviteit op het klimaat op aarde - Hirs, G. (1997, Nov 14). Zon en klimaat; invloed variatie zonne-energie op het klimaat. Den Haag.
3 - Max Planck Institute: The Sun is more active now than over the last 8000 years (2004)
4 - Secular total solar irradiance trend during solar cycles 21-23 - R.C. Wilson & A.V. Mordvinov (march 2003)
5 - Background solar irradiance spectrum at high and low phases of the solar activity cycle - V. Ramió et al. (september 2002)
6 - Solar p modes in 10 years of the IRIS network - D. Salabert et al. (2004)
7 - Re-evaluating the role of solar variability on Northern Hemisphere temperature trends since the 19th century - W. Soon et al. (august 2015)
8 - Predicting the Amplitude of a Solar Cycle Using the North-South Asymmetry in the Previous Cycle: II.
An Improved Prediction for Solar Cycle 24 - J. Javaraiah (march 2009)
9 - Surface warming by the solar cycle as revealed by the composite mean difference projection - C.D. Camp & K. Kit Tung (july 2007)
10 - Wilcox Solar Observatory Polar Field Observations (october 2019)
11 - Prediction of the strength and timing of sunspot cycle 25 reveal decadal-scale space environmental conditions - P. Bhowmik & D. Nandy (december 2018)
12 - The solar magnetic field since 1700. II. Physical reconstruction of total, polar and open flux - J. Jiang et al. (february 2011)
13 - The role of solar forcing upon climate change - B. van Geel et al. (1999)
14 - Increased ionization supports growth of aerosols into cloud condensation nuclei - H. Svensmark et al. (december 2017)
15 - IPCC underestimate the sun's role in climate change - B. van Geel & P.A. Ziegler (2013)
16 - Fourier analysis of measurements and Earth System Model simulations - S. Henriksson (october 2012)
17 - Continental-scale temperature variability during the past two millennia - PAGES 2k network (2013); ruwe temperatuur data voor de individuele continenten wordt gepresenteerd in database S2
18 - Sun's motion and sunspots - P.D. Jose (april 1965)
19 - Planetary resonances, bi-stable oscillation modes, and solar activity cycles - H.P. Sleeper (april 1972)
20 - Heartbeat of the Sun from Principal Component Analysis and prediction of solar activity on a millenium timescale - V. Zharkova et al. (october 2015)
21 - The Role of the Solar Forcing in the 20th century climate change - N.J. Shaviv (2012)
22 - Length of the solar cycle: an indicator of activity closely associated with climate - E. Friis-Christensen & K. Lassen (1991)
23 - Solar Changes and the Climate - J. D'Aleo et al. (march 2009)
24 - Using the oceans as a calorimeter to quantify the solar
radiative forcing
- N. Shaviv (2008)
25 - Wikipedia: "Het klimaat is de gemiddelde weerstoestand (temperatuur, windkracht, bedekkingsgraad en neerslag) over een periode van minimaal 30 jaar."
26 - Change detection in hydrological records - a review of the methodology - W. Kundezewicz & A. Robson (february 2004)
27 - KNMI: Future Weather, (2012); pagina 9 beschrijft: "Generally such a climatological period is defined as a 30-years period, although we note that even 30 years may be too short to capture all natural climate variability."
28 - KNMI'14: Klimaat Scenarios voor Nederland (2014); pagina 6: "De twee kolommen met waarnemingen laten zien dat de toename in de winterneerslag over 30 jaar ongeveer even groot is geweest als de natuurlijke variaties gemiddeld over 30 jaar", pagina 8: "Hoe langer de periode waarvoor een gemiddelde wordt berekend, hoe kleiner de invloed van natuurlijke variaties op dit gemiddelde is. Maar zelfs gemiddelden over 30 jaar - het ijkpunt van wat als normaal weer wordt gezien - zijn erdoor beïnvloed (zie figuur 1). Vooral voor neerslag en wind zijn natuurlijke variaties in gemiddelden over 30 jaar aanzienlijk vergeleken met de veranderingen in de 30-jaar gemiddelden volgens de klimaatscenario's."
29 - A solar irradiance climate data record - O. Coddington et al. (july 2016)
30 - Modelling the sun's magnetic field and irradiance since 1713 - Y.-M. Wang et al. (may 2005)
31 - 8 Anthropogenic and Natural Radiative Forcing. In: Climate Change 2013: The Physical Science Basis. Contribution of Working Group I to the Fifth Assessment Report of the Intergovernmental Panel on Climate Change (may 2013); figuur 8.11, pagina 689
32 - An 800-year ultraviolet radiation record inferred from sedimentary pigments in the Ross Sea area, East Antarctica (july 2015)
33 - Simplified mathematical model for calculating global warming through anthropogenic CO2 - E. Specht et al. (april 2016)
34 - A History of Solar Activity over Millennia - Y.G. Usoskin (april 2010)
35 - Testing an astronomically-based decadal-scale empirical harmonic
climate model versus the IPCC (2007) general circulation climate models
- N. Scafetta (january 2012)
36 - Key evidence for the accumulative model of high solar influence on
2 global temperature
- D.R.B. Stockwell (augustus 2011)
37 - Empirical evidence for a celestial origin of the climate oscillations and its implications
- N. Scafetta (may 2010)
38 - The complex planetary synchronization structure of the solar system - N. Scafetta (may 2014)
B1 - Synchronized Helicity Oscillations: A Link Between Planetary Tides and the Solar Cycle? - F. Stefani et al. (august 2016)
CLIMATE INDEX:
•
Millennium analysis: climate sensitivity CO2 is below IPCC bandwidth
•
IPCC dataset sun explains half of warming since 1815
•
Impact sun on climate is underestimated significantly
•
Since 17th century: +1,1 °C by sun
• 1890-1976: Sun shows perfection correlation with temperature
• Side-role for CO2: solar activity explains warming since 1976
• Impact of CO2 on climate overestimated (substantially) due to 66-year cycle & El Nino
What do proxy climate indicators show?
• 2° Institute proxies: temperature rose in the past multiple decennia in a row even faster
• PAGES 2k Network illustration (2013)
• PAGES 2k Network illustration: 2019 hockeystick graphic vs 2013 temperature data
ClimateCycle articles in Dutch language:
•
IPCC dataset zon verklaart met vulkanisme helft opwarming sinds 1815
•
Tussen 1685 en 1976 volgde de temperatuur de totale zonnestraling
• Boekrecensie: SOLAR MAGNETIC VARIABILITY AND CLIMATE
•
Online seminar door zonnefysicus Dr. Greg Kopp: 'Zonnestraling & klimaat'
•
Impact zon op klimaat fors onderschat
•
Sinds 17de eeuw: +1,1 °C door zon
•
SAMENVATTING: Hoe ontstaat de Klimaatcyclus en wat is haar impact?
• 1890-1976: Zon toont perfecte correlatie met temperatuur
• Zon verklaart opwarming sinds 1976
• El Nino & 66-jarige cyclus: CO2 overschat
• 70-Jarige cyclus: opwarming overschat
• Global warming vs fluctuaties in 2 dagen
• Oceaan: diepzee koelt af
• KlimaatCyclus.nl