Primary minima in 22-year-old solar cycle show 'perfect correlations' with temperature after corrections for volcanism and ozone problem: CO2 impact is nihil
February 21, 2020 - Author: Martijn van Mensvoort | ![]() Dutch version |
Dutch version | ![]() English version
English version
The sun is a hot gas sphere with fluctuations that arise due to magnetic activity. These fluctuations manifest through a range of magnetic phenomena, such as: sunspots, faculae and flares1. A large part of these fluctuations is determined by the magnetic solar cycle, which has a length of ~22 years [= Hale cycle]. The magnetic poles of the sun change polarity halfway through this cycle; this implies that the magnetic cycle includes 2 solar cycles of each ~11 years [= Schwabe cycle]2.
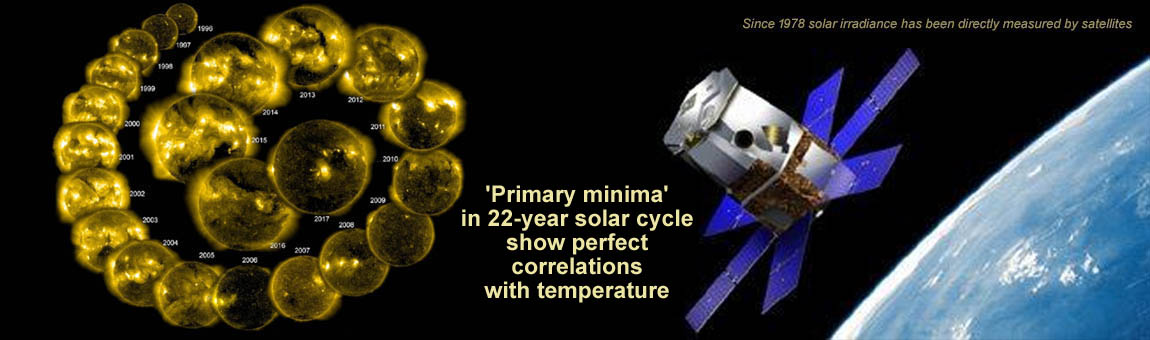
This article focuses primarily on the 'primary minima' of the 22-year magnetic solar cycle; these involve the minima for the 'Total Solar Irradiance' [TSI] that arise when the magnetic poles of the sun are in their original position. Attention is also paid to the impact of the 'secondary minima', which arise in the phase of the cycle where the poles have changed position. The importance of the minima is reflected in the fact that this represents the most stable phase of the solar cycle, which is known as the 'inactive phase' in which, in particular, few sunspots and flares are produced.
After a correction for volcanism, the temperature of both the atmosphere (HadCRUT4 temperature series3) and the seawater surface (HadSST34) shows an almost 'perfect correlation' with the primary minima of the TSI (LISIRD) for the period 1890-1976: r > 0,993 [p=0,000]. Based on average values of the LISIRD TSI data set5 and the IPCC AR5 TSI data set6 the intermediate secondary minima in the period 1902-1965 also show a 'perfect correlation' for both the atmosphere and seawater surface: r > 0,994 [p=0,000]. Based on these perfect correlations, it is concluded that the influence of the increase in CO2 has been nihil in the warming of ~0.2°C that occurred between 1890 and 1976. The perfect correlations prove that there must be an amplification mechanism for the relatively small fluctuations in the sun's activity at the minima of the magnetic solar cycle. The ENSO cycle probably plays a key role here by means of a complex mechanism, because both solar minima and solar maxima often cause negative ENSO values. In addition, the last 3 super El Ninos have occurred during 3 of the 4 most extreme changes in momentum of the solar movement around the barycenter.
Moreover, at the seawater surface temperature for the period 1890-2017, during 5 of the 6 magnetic solar cycles the change is almost entirely explained by the fluctuations in solar activity. Only the temperature rise during the cycle between 1976-1996 is clearly not explained by solar activity; this is the period when the hole in the ozone layer was formed. The 'footprint' of this isolated deviation in the period 1976-1996 points in the direction of a specific group of greenhouse gases, namely: the CFCs (chlorofluorocarbons) - which are known as highly aggressive greenhouse gases whose use has been banned worldwide since 1987. The use of CFCs was largely phased out in the 1990s, with the result that the ozone layer has been in a state of recovery since 2000. After an additional correction based on the size of the hole in the ozone layer, a 'perfect correlation' is also described based on the primary solar minima and the seawater surface temperature for the period 1890-2017; using almost the same corrections for the atmosphere a likewise 'perfect correlation' is described based for the period 1890-1996.
The conclusion is that between 1890 and 2017, the warming of the seawater surface (+0.9°C) was caused for 2/3 by the sun and for 1/3 by the use of CFCs (particularly in the period 1976-1996). The strong correlation between CO2 and temperature is therefore based on a spurious connection that arises from a combination of increased solar activity and a temporary impact of CFCs. Globally +0.13°C extra warming is found in the period 1996-2017 (compared to the warming of the seawater surface); this extra warming is attributed to a mix of anthropogenic factors in which the 'footprint' of CO2 is missing.
Multiple TSI data sets confirm a pattern at the primary minima that runs largely parallel to the multi-decadal oscillation in the temperature development of Earth's lower atmosphere. Both the LISIRD TSI data set and the TSI data set used by the United Nations Climate Panel [IPCC] in AR5, show very high correlations with the HadCRUT4 temperature series at both the primary minima in the 1890-1976 period and the secondary minima in the period 1902-1985. For the primary minima, the correlations are in the order of +0.96 and for the secondary minima in the order of +0.93.
Crucial is that all TSI data sets show in the last downward phase of the multi-decadal cycle a significantly less downward directed trend than the temperature trend. This difference decreases after a correction for volcanism [AOD7 = aerosol optical depth]. 'Perfect correlations' are found when a relatively high weight is assigned to the AOD value; by the way, high weights are commonly used in climate models (up to values at the order of at least 4).
The IPCC often refers to the 11-year solar cycle in AR5, but the 22-year magnetic solar cycle is never mentioned. In the "expert review comments" report attached with the AR5 report (2013), one expert reviewer refers to the 22-year cycle, but the IPCC itself does not mention the subject in her answer neither8. However, the IPCC does recognize in AR5 that in studying long-term changes in solar activity, the attention is usually focused on the minima, as these are both a more "stable" and also a more "relevant" indicator of the long term trend, in comparison to the maxima9.
TIP: Figure 6 describes that in the period 1890-2017 seawater surface temperature (after a high correction for volcanism)
has followed solar activity fairly accurately during 5 of the 6 magnetic cycles. Figure 7 describes in 2 steps how a 'perfect correlation' is found between the sun and seawater surface temperature for the period 1890-2017.
CONTENT
• I - Primary solar minima explain all warming in the period 1890-1976
• II - Gnevyshev-Ohl 'even-odd' rule for sunspot cycle maxima also applies to TSI minima
• III - Primary minima in IPCC data set show +0,94 correlation with temperature in the period 1890-1976
• IV - Seawater surface temperature confirms: the sun explains all warming in the period 1890-1976
• V - Spurious correlation between CO2 and seawater surface temperature explained by sun (2/3) + CFCs (1/3)
• VI - Controversy between PMOD & ACRIM research teams on TSI minima + influence solar on climate
• VII - Solar minima show strong 'footprint' in the ENSO cycle: 80.8% of the 120 months are negative
• VIII - Discussion & conclusion
(Data: Excel data file)
I - Primary solar minima explain all warming in the period 1890-1976
Figure 1 shows the LISIRD TSI data set combined with the HadCRUT4 temperature series. Correlations with temperature are for the primary minima in the period 1890-2017 [r = +0.880; p=0.005] as well as the secondary minima in the period 1879-2008 [r = +0.897; p=0.008] significantly higher than is the case for all minima together in the entire period 1879-2017 [r = +0.801; p=0.000] - though the significance level in the combination with all is slightly higher.
The secondary solar minima appear to play a key role in the emergence of the peak years of the multi-decades cycle, while the primary minima play a key role in the emergence of the bottom years of the multi-decades cycle.
The lower part of Figure 1 describes that at the primary minima during 4 magnetic solar cycles, both with and without a temperature correction for volcanism, a pattern is found that closely resembles the multi-decadal cycle in the temperature trend on earth. With correction for volcanism (the AOD values have been multiplied by a weight of 1.15), the correlation for the primary minima increases in the period 1890-2017 to +0.975 [p=0.000]. Doubling the weight of the AOD leads to a further increase in the correlation, the value rising beyond the value +0.990; with a tripling an almost perfect correlation is formed: r = +0.993 [p= 0.000].
However, a considerably erratic picture is found with the secondary minima (also when combined with the primary minima); both a doubling and tripling the weight of the AOD leads to a limited increase in the correlation.
Figure 1: The warming between 1890 and 1976 is fully explained by the LISIRD primary solar minimum years, indicated by a perfect correlation (with a high correction for volcanism: AOD weight = 3.45 results in r = 0.993 [p=0.000]). With an AOD weight varying from 2.24 to 3.89, the correlation between the LISIRD and the HadCRUT4 in the period 1890-1976 remains at a value that is constantly higher than +0.99 [r > +0.990; p<0.001]. The secondary solar minima play a key role in the formation of the peak years in the multi-decadal cycle of the temperature development on Earth. In the secondary years a perfect correlation is found in the period 1923-1965 on the basis of an AOD weight of 1.15 [r = 0.9997; p=0.000]. For the period 1996-2017, approximately 60% of the temperature rise is explained by the sun.
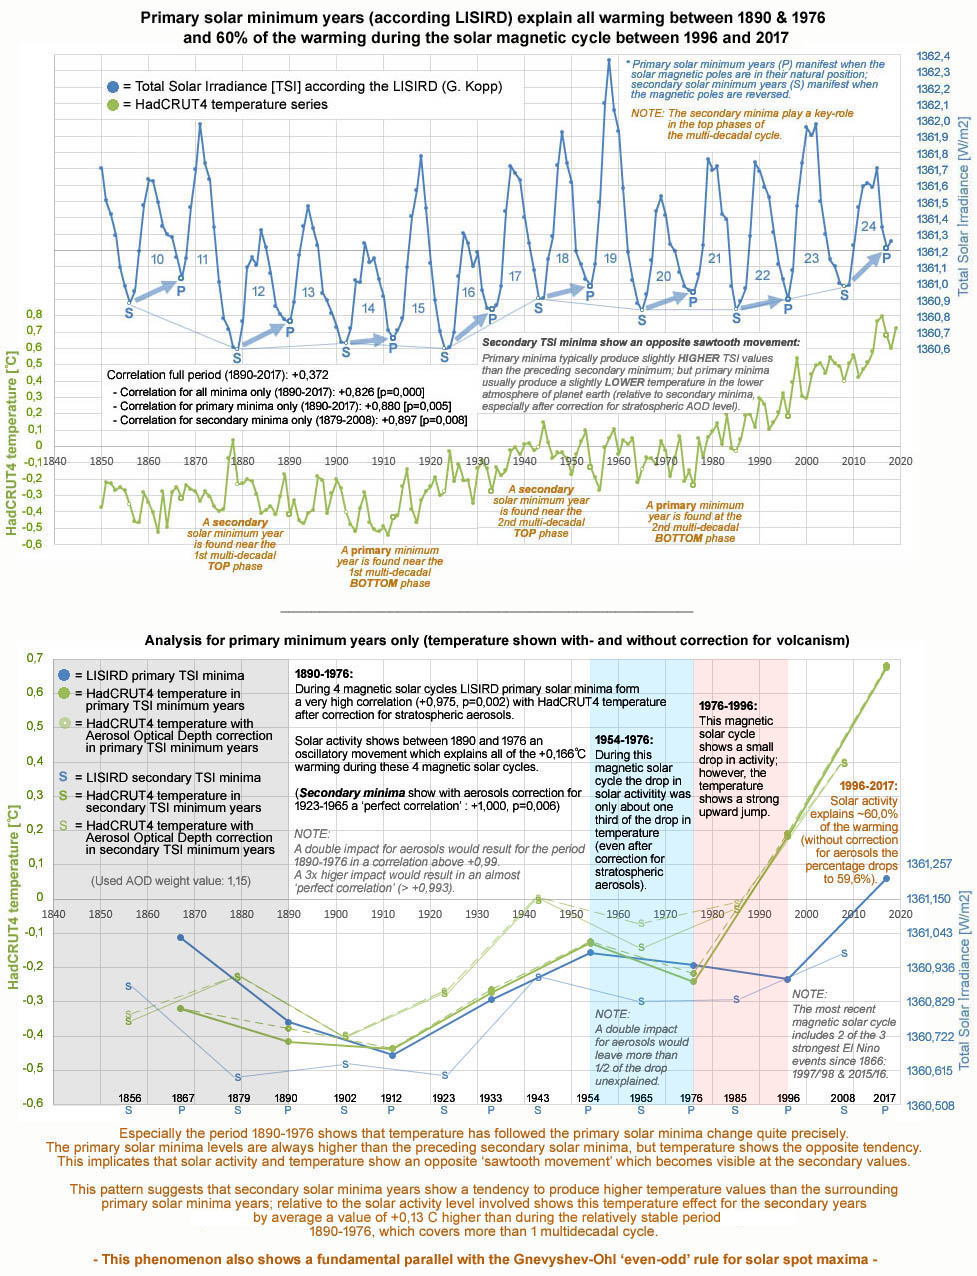
METHOD: The AOD weight 1.15 was determined on the basis of an analysis focused on the ratios between various HadCRUT4 values in the period 1890-1976 and the corresponding values in two TSI data sets (LISIRD & IPCC AR5); with both the primary and the secondary minima are involved. When the AOD weight value is 1.15, a high degree of balance is found between the values in the perspectives involved. However, with higher AOD values, higher correlations arise between the HadCRUT4 and the primary values for both TSI data sets separately (details are described in the next paragraph). The correlation values become often even higher than the correlation among the 2 TSI data sets. With a tripling of the AOD weight (3.45), an almost 'perfect correlation' is found: r = +0.993 [0.000]. The p-values of the correlations are calculated with PSPP.
Figure 1 also shows a trend that is related to the Gnevyshev-Ohl 'even-odd' rule (see Figure 2), which is described in the scientific literature to be related the course of the maxima in the sunspot cycle. For, figure 1 shows that from the year 1856 onwards the secondary minima in the LISIRD TSI always show a lower level compared to the following primary minimum. The TSI level of the secondary minima is usually also lower than the average of the adjacent primary minima. Of particular importance is that a reversed trend is usually present in the related temperature development, because the secondary temperature is usually higher than the average of the adjacent primary temperatures. This phenomenon describes the presence of an "opposite sawtooth movement" between the TSI and the temperature at the transitions between the primary and secondary minima. This phenomenon also largely explains the relatively low correlation described for all minima together, relative to the primary and secondary minimums separately.
Finally, figure 1 describes for the period 1996-2017 that the sun explains about ~60% of the warming, which is considerably higher than for period 1976-1996 (in this latter period the sun clearly cannot explain the warming). Section IV will show for the perspective of seawater surface temperature that the sun plays an even greater part in the warming during the period 1996-2017. For that perspective will also be shown that the ocean system shows only in the period 1976-1996 a warming 'footprint' that cannot be explained by the sun.
II - Gnevyshev-Ohl 'even-odd' rule for sunspot cycle maxima also applies to TSI minima
Figure 2 shows according to the 'even-odd' rule of Gnevyshev-Ohl that in the sunspot cycles after 1850 the 2nd peak was usually lower than the first peak. The reversed pattern is found before the year 1800. Figure 2 also describes that among the total of 14 magnetic cycles that originated from the year 1712, at 3 maxima an irregularity is found (where no repetition following a change in trend direction).
Figure 2 (= Fig.1.): The 'even-odd' rule of Genvyshev-Ohl describes that in the sunspot cycle the peak values show a pattern featured with higher and lower peaks that follow one another within 1 magnetic solar cycle of 22 years.10.
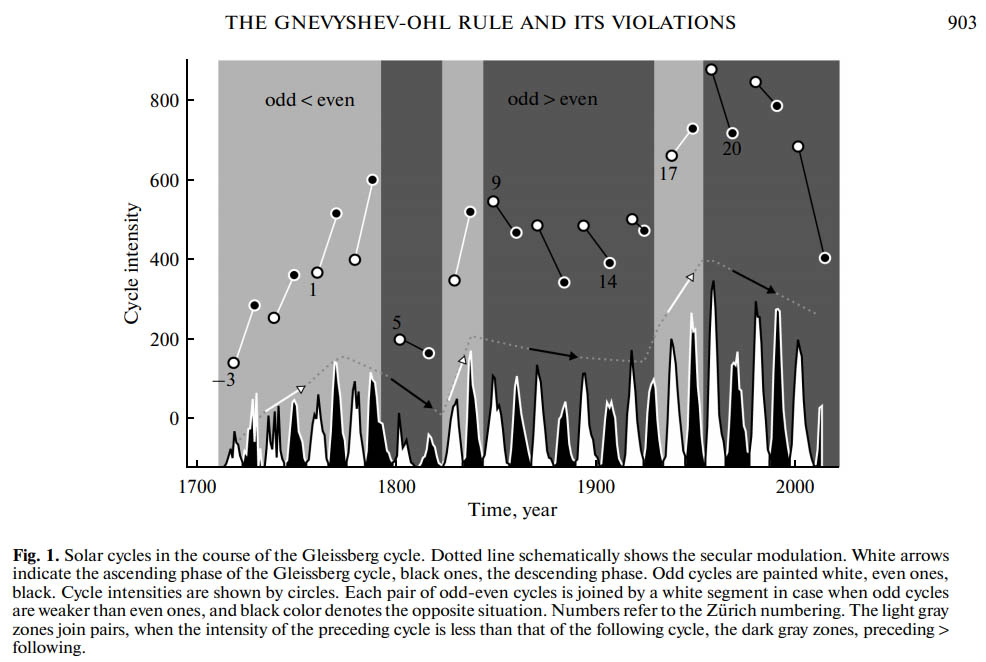
The minima of the full LISIRD TSI (exhibited at the LASP website) also show a reversing pattern in the period 1712-1850 compared to the period after 1850. In fact, the minima from the year 1766 onwards show no irregularity at all at the transitions from the secondary minima to the primary minima (in the upper part of figure 1 this is also made visible by means of the presence of upward directed arrows only).
Finally, it is also relevant that the phenomenon at the minima in the period from 1712 is usually opposed to the transitions at the maxima based on the Gnevyshev-Ohl rule; this applies to 11 out of 14 magnetic cycles. This phenomenon is indicative for a physics phenomenon in which the described trends at the minima and maxima within one magnetic cycle are offset by an opposite movement. This partly explains why a more erratic trend is found with regard to the maxima compared to the more stable minima.
In the period from 1850 onwards, this phenomenon explains some of the 'climate noise' within earth's climate system featured with a temperature impact of on average +0.13°C at the secondary minima compared to the primary minima (this impact is only based on an imaginary comparison between the temperature values and the corresponding values of the secondary and primary TSI minima, as shown in Figure 1).
III - Primary minima in IPCC data set show +0,94 correlation with temperature in the period 1890-1976
In figure 3, the TSI data set has been added that is used in the latest IPCC comprehensive climate report (AR5 2013). Figure 3 shows that the TSI data set of the IPCC for the period 1890-1976 shows a similar oscillating movement that runs parallel all the way with the temperature development on earth (both without and with the stated AOD correction). Correlation with temperature (without AOD correction) is: +0.94 [p = 0.008]; with the AOD correction shown, the correlation increases further to: +0.95 [p = 0.006].
It is noteworthy that the correlation between the LISIRD and the temperature [r = +0.975; p=0.003] is even a fraction higher than the mutual correlation between the LISIRD and the IPCC AR5 TSI [r = +0.967; p=0.004]. For, based on logics one should expect that the LISIRD and the data set of the IPCC should show a higher correlation with each other than the correlation of both with the temperature. This expectation is not met, which in this case represents itself an indication that all three are strongly related to each other. This observation confirms the result described in paragraph I in which the solar activity fully explains the temperature fluctuations between 1890 and 1976.
Figure 3: Primary minima in IPCC AR5 TSI data set 4 show a +0.94 [p = 0.008] correlation with temperature for the period 1890-1976 (without correction for volcanism).
![Figure 3: Primary minima in IPCC AR5 TSI data set <sup>4</sup> show a +0.94 [p = 0.008] correlation with temperature for the period 1890-1976 (without correction for volcanism).](http://klimaatcyclus.nl/klimaat/pics/LISIRD-total-solar-irradiance-primary-and-secondary-minima-vs-HadCRUT4-temperature-IPCC-AR5-TSI.jpg)
In the IPCC data set, the secondary minima for the period 1902-1985 show a comparable correlation with the temperature [without AOD correction: r = +0.880; p=0.025; with AOD correction: r = +0.93; p=0.010] compared to the correlation between the LISIRD and the temperature [without AOD correction: r = +0.913; p=0.017; with AOD correction: r = +0.929; p=0.012]. The data set of the IPCC shows for the period 1902-1985 for the perspective of the secondary minima a value that hardly differs from the value at the LISIRD. It is striking that in this case the mutual correlation between the two TSI data sets yields even a clearly lower value [r = +0.798; p = 0.012]. This shows that also with for the secondary minima the TSI data sets and the HadCRUT4 temperature series show remarkably strong mutual relationships, where the TSI data sets do not clearly distinguish themselves from the temperature.
Actually, figure 3 shows that in the IPCC data set the phenomenon of the 'opposite sawtooth movement' is clearly less present. The impact on the temperature differences between the primary and secondary temperatures (compared to the corresponding TSI values) is hereby limited to a value of just +0.02°C for the secondary minima compared to the primary minima (while in the previous section for the LISIRD more than 6x greater effect is described: +0.13°C).
IV - Seawater surface temperature confirms: the sun explains all warming in the period 1890-1976
In Figure 4, the HadCRUT4 series for the temperature of the atmosphere (worldwide) has been replaced by the HadSST3 series for the surface seawater temperature (worldwide). The previously described image for the minima years in the HadCRUT4 is confirmed in the perspective of the minima years in the HadSST3. Figure 4 also shows that the IPCC AR5 data set clearly confirms that the TSI in the period 1890-1976 fully explains the temperature trend of the seawater.
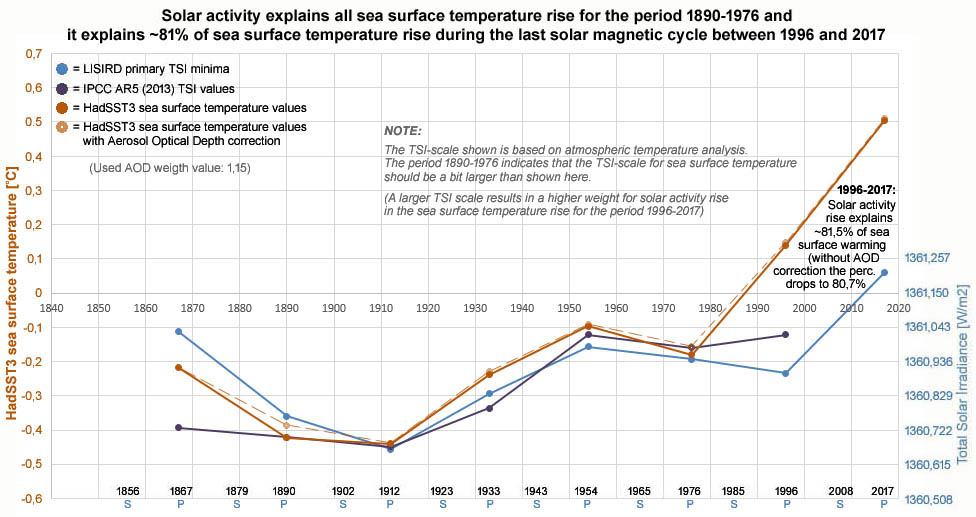
Figure 4: Seawater surface temperature (HadSST3) confirms that the sun fully explains the warming in the period 1890-1976; the correlation is without volcanism correction in this period: +0,956 (with volcanism correction the correlation rises to +0,978). With an AOD weight from 2.11 to 4.50, the correlation between the LISIRD and the HadSST3 in the period 1890-1976 shows a value that is constantly higher than +0.99 [r > +0.990; p<0.001]. The IPCC AR5 data set also confirms for the 1890-1976 period that the sun explains global warming and that the TSI drop between 1954 and 1976 is not larger than the drop in temperature.
Figure 4 shows for the period 1996-2017 that for the warming of the seawater the influence of the sun exhibts a considerably higher percentage (~ 95%) than the 60% that in the lower part of figure 1 for the same period has been described with regard to warming the warming on a global scale.
In the next section it becomes clear that in the perspective of warming up the seawater surface, the sun also appears to be almost entirely responsible for the warmin in the period 1996-2017. This is important because, according to the World Meteorological Organization (WMO) - this is the umbrella organization of the United Nations in the fields of weather, climate and water - the ocean heat content is considered to represent a more reliable indicator of global warming than atmospheric temperature rise11,12,13.
V - Spurious correlation between CO2 and seawater surface temperature explained by sun (2/3) + CFCs (1/3)
In climate science, reference is often made to the strong statistical correlation between CO2 and temperature; figure 5 describes this relationship (illustration: Geert Jan van Oldenborgh, KNMI14). Henry's Law 15 describes that as the temperature rises, the concentration of CO2 in the atmosphere increases (as a result of a decrease in the resolving power of CO2 in ocean water). Experts have also described that the temperature rise itself since 1850 explains about 15% of the rise in CO216. Moreover, it appears that CO2 follows the temperature in all natural cycles, and not the other way around; this applies to: the annual cycle17, the seasonal cycle17, and the Ice Age cycle18.
In short, despite the strong correlation between CO2 and temperature, on the fundamental grounds mentioned (Henry's law + natural cycles) this connection can itself not be recognized to represent "evidence" for the existence of a causal relationship in which the rise in CO2 led to the rise in temperature. After all, the available empirical evidence based on the natural mechanisms points in the direction of an opposite relationship in which the temperature influences the amount of CO2, and not the other way around.
Figure 5: CO2 shows a strong correlation [r = 0.942] with the temperature (the pink years are the primary minimum years of the LISIRD TSI); however, this strong correlation itself does not tell anything about the mutual relationship in terms of cause and effect. For the period 1880-1970 this correlation is clearly lower [r = 0,616].
![Figure 5: CO2 shows a strong correlation [r = 0.942] with the temperature (the pink years are the primary minimum years of the LISIRD TSI); however, this strong correlation itself does not tell anything about the mutual relationship in terms of cause and effect.](http://klimaatcyclus.nl/klimaat/pics/Oldenborgh-GISS-temperature-CO2-1880-2018.jpg)
The climate system itself does not present direct empirical evidence found which suggests that the monotonous rise in CO2 is largely responsible for the rise in temperature since 1850. However, empirical evidence was presented for the first time in 2015, which shows that CO2 has some influence (~ 10% of the trend) on the 'back radiation' of long wave radiation (infrared radiation) from the atmosphere49. Nevertheless, the IPCC claims that it is "highly likely" that more than half of the warming between 1951 and 2010 is due to the combination of greenhouse gases and other anthropogenic forcings; moreover, according the IPCC claims that to the "best estimate", the warming in this period was caused entirely by the combination of both factors19,20.
Figure 6 shows the seawater surface temperature (with a high AOD correction weight of 3.29) for the primary minimum years in the LISIRD TSI data set. Figure 6 shows that for the period 1890-1976 it is confirmed (again) that the warming up to 1976 can be attributed to the sun; no less than 97.6% of the warming between 1996 and 2017 is explained by increased solar activity. Moreover, for the period 1890-2017 no less than 59.2% of the warming is explained by the increase of solar activity. Figure 6 also exhibits clearly that only the warming between 1976 and 1996 cannot be attributed to the sun.
In the period after 1976, around +0.225°C extra warming is found on a global scale relative to the seawater surface temperature (according to the data sets of the Hadley Center, however, according to the data sets of NASA the difference comes out at +0.30°C). Later on in this paragraph it will become clear that after correction for volcanism and the ozone problem this warming effect can be entirely attributed to the period between 1996 and 2017 - the magnitude does increase slightly further to +0.13°C. It should be noted that in the 2nd half of the 19th century shows an inverse effect that can be attributed to air pollution above land due to anthropogenic activities (resulting in a high concentration of black carbon).
Figure 6: For the period 1890-2017, 59.2% of the rise in HadSST3 seawater surface temperature (after a high correction for volcanism: AOD weight = 3.29) can be attributed to the increased solar activity (LISIRD TSI). Also, in the period after 1976 around + 0.225°C extra warming is found in the atmosphere compared to the seawater surface temperature (in figure 6 the extra warming seems larger because the data sets from NASA show clearly higher absolute values for both seawater and atmosphere compared to the Hadley Center data sets). A similar graph for the GISSTEMP temperature of the atmosphere (without correction for volcanism) is available HERE.
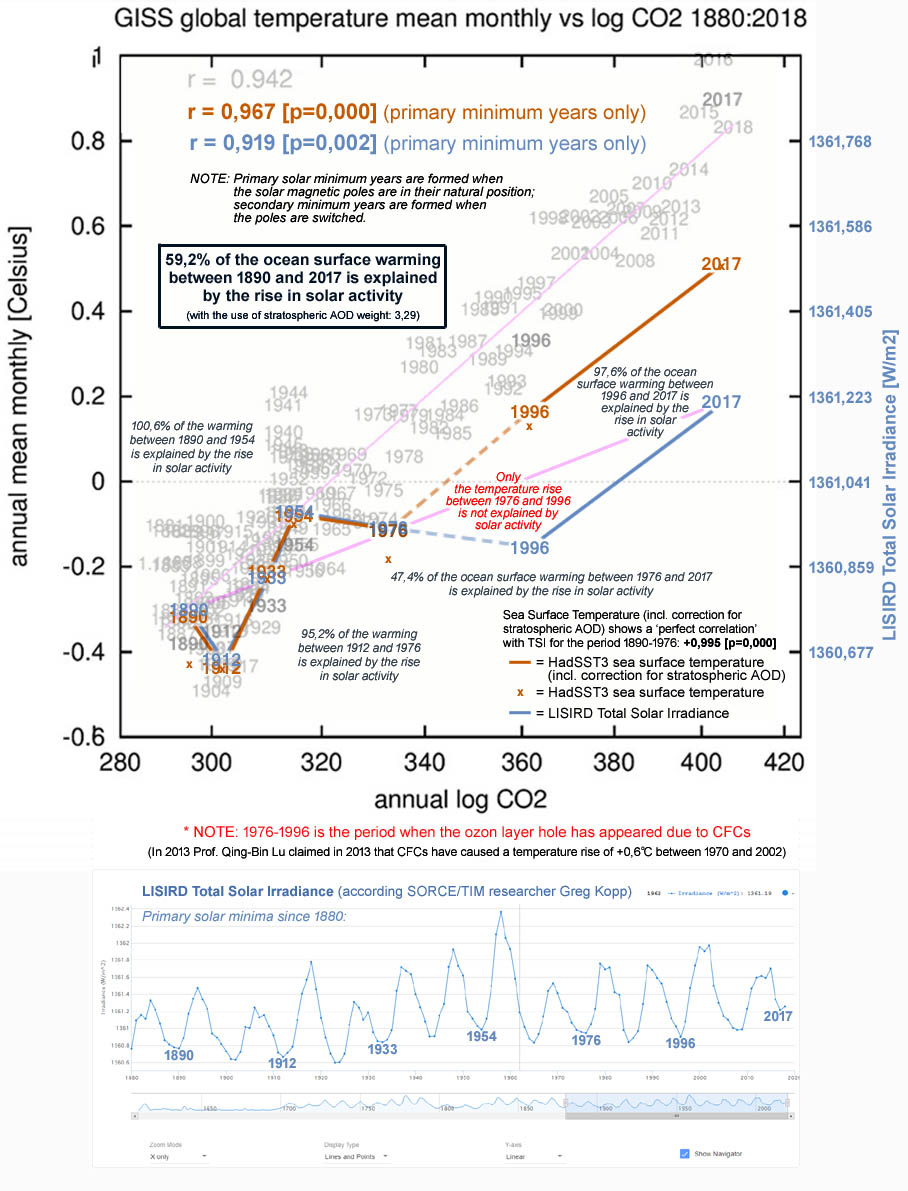
METHOD: The AOD weight value of 3.29 was determined based on an analysis focused on the relationships between all HadSST3 minimum values in the period 1890-1976 and the corresponding LISIRD TSI values. This results in an almost 'perfect correlation': +0.995 [p=0.000]. The percentages shown are based on ratios found after transformation of the TSI scale to show the same values as the temperature scale; the formula is integrated in the Excel data file. The period prior to the year 1880 is not taken into account in this analysis; for, according to NASA, the measurements prior to the year 1880 are not sufficiently reliable and the TSI data sets show for the period 1850-1880 rather large differences between the LISIRD and the IPCC AR5.
The Excel data file describes that correlations for CO2 and both the LISIRD and the HadSST3 (both with and without AOD correction) are within a very small bandwidth that varies from just +0.732 to +0.740 for the primary minima years in the 1890-1976 period.
Figure 6 exhibits that the high correlation between CO2 and temperature is by no means isolated and also not unique; for, a particularly strong relationship is also found between the primary solar minimums and CO2. With the minima based on a double magnetic cycle, the years 1890s, 1933, 1976 and 2017 are found on a straight line in the perspective of Figure 6. The correlation between the primary solar minima and CO2 [r = + 0.919; p = 0.002] is just slightly lower than the correlation between the temperature and CO2 [r = + 0.967; p = 0.000]. However, the course shows that in 5 of the 6 magnetic cycles the temperature fluctuation sort of entirely follows solar activity; only for the period 1976-1996 can the temperature rise not be explained by the sun. Because this is a temporary deviation only, it cannot be explained either by CO2, nor by a combination in which CO2 plays a major role. Since the period 1976-1996 corresponds to the time span in which the ozone layer depletion became manifest as well and it is known that this phenomenon mainly arose as a result of the use of the CFCs, it is concluded that the CFCs - which are known to represent a very aggressive non-natural group of greenhouse gases - have been responsible for this temporary deviation.
Based on figure 6, it is concluded that the statistical relationship between CO2 and seawater temperature rise is based on a spurious relationship, during 5 of the 6 magnetic solar cycles is the relation approximately entirely explained by the solar activity (when temperature is corrected with a considerably high weight for stratospheric aerosols). Only during the magnetic cycle in the period 1976-1996 provides the influence of CFCs the most important underlying explanation for the warming.
Finally, Figure 7 shows that in addition to the 22-year solar cycle, both volcanism (AOD) and the size of the hole in the ozone layer represent important factors to develop a better understanding of the relationship between the solar activity and the temperature development (figure 7 shows the seawater surface temperature on the Y-axis) on Earth.
Figure 7: Dynamics between the LISIRD TSI during the primary minimum years and the HadSST3 seawater surface temperature, with and without corrections for in respective: volcanism (AOD) and the size of the hole in the ozone layer. Figure 7D shows a 'perfect correlation' between the sun's activity and the corrected seawater surface temperature based on the minimum years for the period 1890-2017.
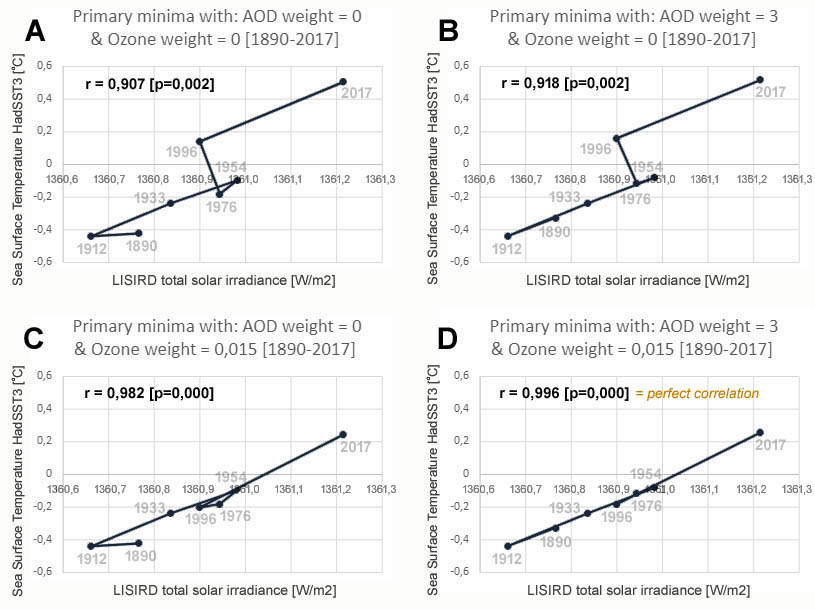
Figure 7 shows a 'perfect correlation' for the entire 1890-2017 period, after large corrections for volcanism and the size of the hole in the ozone layer (due to CFCs). The weights stated in the formula below apply figure 7D. The specific weights used for the corrections only have an indicative value because they are used here purposefully in order to demonstrate visually the dynamics involved with the relationship between solar activity and the temperature development and also in order to quantify the potential of this relationship.
Corrected seawater surface temperature = HadSST3 + (AOD x 3) - (ozone hole area x 0,015)
A perfect correlation is found between the corrected seawater surface temperature (after correction for both volcanism and ozone hole size) and the LISIRD [r = +0.996; p=0.000] for the period 1890-2017. It is also striking that the correlation between corrected seawater surface temperature and CO2 is considerably lower [r = +0.85; p=0.007]. Without ozone correction, the correlation between CO2 and the HadCRUT4 is higher for the period 1890-2017. However, for the period 1890-1976 without ozone correction this correlation is [r = +0.967; p=0.001] almost of equal size relative to the correlation between the TSI and the HadCRUT4 [r = +0.956; p=0.001]. From a fundamental point of view, the large impact of the hole in the ozone layer can be easily understood because the ozone layer forms an important part of the atmosphere, as it offers protection against the influence of the sun. This is illustrated by the fact that the ozone layer converts UV radiation into oxygen, among other things.
Applying almost the same principles (AOD weight = 3 and OZONE weight = 0.017) to the perspective of the HadCRUT4 for the period 1890-1996, a similar 'perfect correlation' [r = 0.982; p=0.000] is found. Where for the period 1996-2017 the temperature rise of the seawater surface temperature after correction for volcanism and the ozone problem can be fully explained on the basis of increased activity of the sun, about 0.13°C of the temperature rise of the atmosphere cannot be explained by the sun. This represents another 'anthropogenic effect' (next to the CFKs-ozone mechanism). However, this phenomenon is absent in the seawater surface temperature rise, therefore this phenomenon must be entirely attributed to mechanisms that take place on the continents. The alleged 'footprint' that is attributed to CO2 and other natural greenhouse gases is missing here as well.
Volcanism also contributes to the spurious relationship between CO2 and temperature, because a correction for volcanism usually reduces the correlation by a few hundredths; this involves the period before 1970 and thereafter. This analysis demonstrates that three factors play a crucial role in this matter: the sun, the ozone problem due to non-natural greenhouse gases (CFCs) and volcanism.
In recent years, several claims have been presented in the scientific literature by researchers who conclude, through fundamentally different research approaches, that the CFCs have had a temporary but very significant impact in the warming since the 1970s. In 2013, Prof. dr. Qing-Bin Lu of the University of Waterloo (Canada) describes in a publication that CFCs in combination with cosmic radiation (under the influence of the solar magnetic field) are responsible for warming since 185021. And in January 2020, a group of researchers from the US, Canada, and Switzerland describe in a publication that between 1955 and 2005, CFCs accounted for about 1/3 of global warming + about half of warming at the North Pole22.
VI - Controversy between PMOD & ACRIM research teams on TSI minima + influence solar on climate
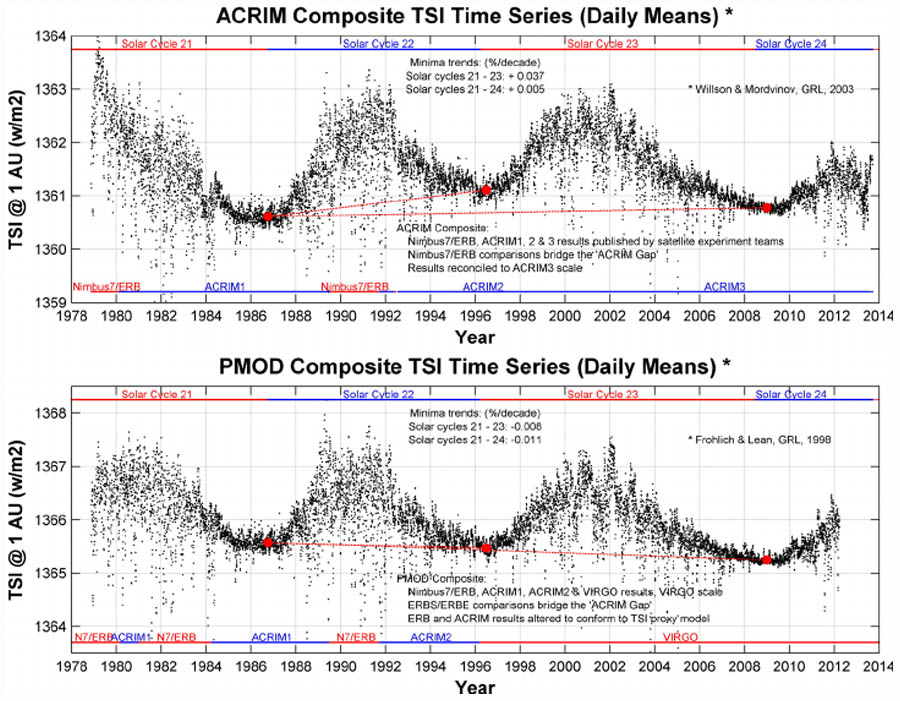
The influence of the sun has been measured since 1978 with satellites. The ACRIM satellite system served for a long time to realize the most reliable TSI measurements. However, the Space Shuttle Challenger accident in 1986 resulted in a 2-year delay in planning to replace the measuring equipment in time (replacement is necessary because the quality of the measurements is constantly deteriorating under the influence of UV radiation from the sun).  The consequence is that within the ACRIM TSI series an interruption has arisen between the ACRIM1 and ACRIM2 measurements in the period 1989-1991 (see figure 823).
This ACRIM research team was forced to bridge the gap on the basis of 2 less accurate measuring systems; they used for this purpose the Nimbus-7/ERB and ERBS satellite system. However, both systems were outdated already: the quality of the measurements deteriorated rapidly. Nevertheless, Nimbus-7/ERB produced an upward trend of +0.05% per decade between the minima of solar cycles 21 to 23; however, the ERBS did not produce a significant trend. The ACRIM research team led by Dr. Richard Willson concluded in 2003 that the minima have shown a positive trend of 0.05% per decade since the measurements had started in 197824; a 2014 publication presented by Willson shows that this estimate was slightly reduced at a later stage to +0.037% per decade25.
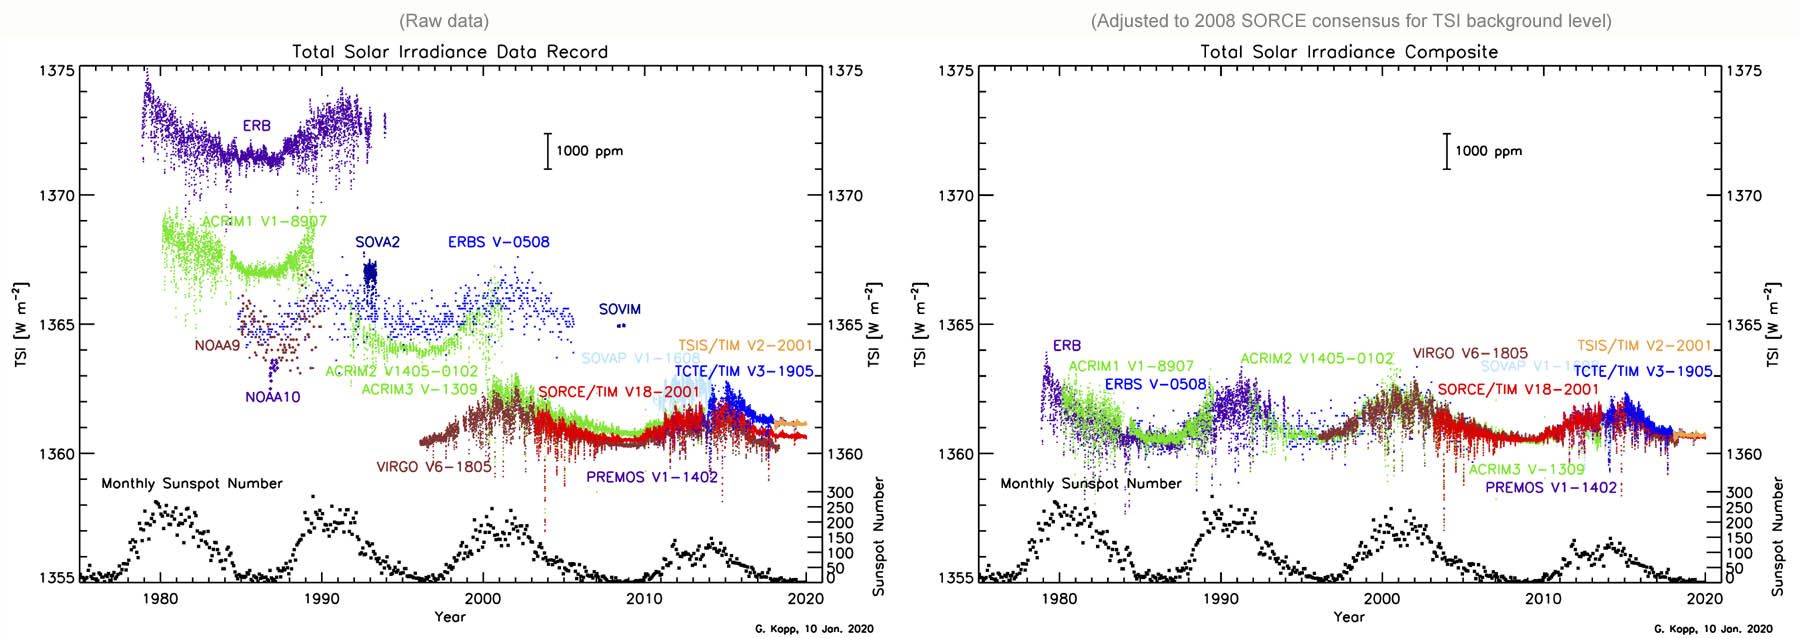
Figure 8: Raw data total solar radiation (TSI) raw measurements with satellites since 1978.
However, in the meantime another research team (PMOD, led by Claus Frölich) did not trust the judgment of the ACRIM specialists and came to the conclusion - on the basis of, among other things, proxies - that the TSI series required a downward correction due to the ACRIM gap24. It is essential here that the outcome of the PMOD team results in a negative trend; despite the fact that the data from both the other satellite systems (Nimbus-7 / ERB and ERBS) do not support this explanation24.26. This matter created since the 1990s a feud among two TSI expert teams: the ACRIM team and the PMOD team.
The present scientific consensus involving the course of the TSI minima since 1978, assumes the existence of a continuous downward trend, largely based on the proxy model of PMOD researcher Judith Lean. This downward trend is described a.o. at the NASA website as well as Wikipedia. However, this alleged 'consensus' not only contradicts the findings of the ACRIM team, because the most advanced SORCE/TIM system (which measures since 2003 the TSI with a 3x higher resolution than the other satellite systems) also shows a clear upward trend in the course of the minima between 2008 and 2017, see figure 9.
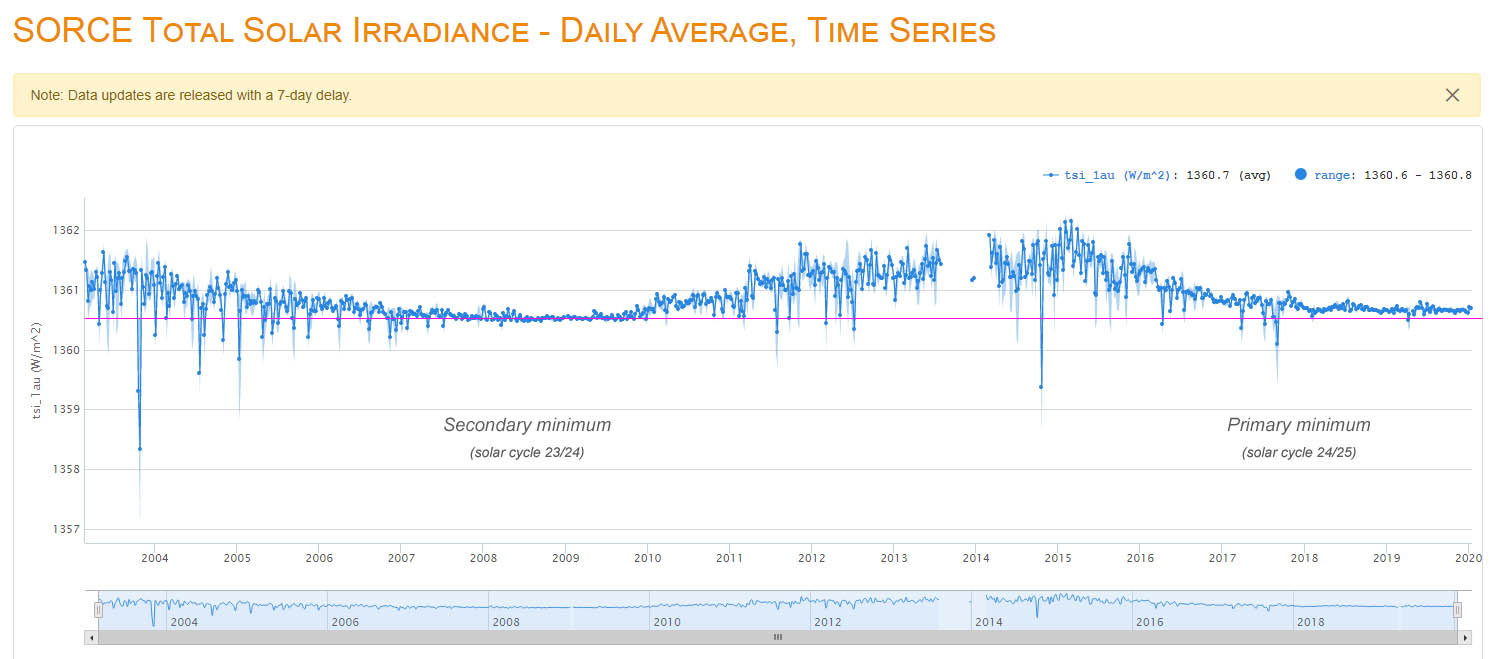
Figure 9: SORCE TSI daily measurements (displayed in values which are representative for approximately the weekly average); the secondary minimum of cycle 23/24 is well below the primary minimum of cycle 24/25.
In November 2019, a publication by, among others, Scafetta & Willson referred26 to statements from 2008 by both the owner of the ACRIM system (Richard Willson) and lead researcher of the Nimbus-7 project (Douglas Hoyt). Willson stated at the time that the PMOD primarily promotes the idea that "anthropogenic causes" would be the main component of global warming, even though the empirical evidence points towards the opposite. Willson also describes herein that corrections made by the ACRIM team for the period 1981-1984 without any form of consultation with the ACRIM team have been extended by the PMOD research leader Fröhlich to 1980 - in a manner that, according to Willson, is "incompatible" with the scientific method. Hoyt has stated that it is physically even impossible for the TSI measurements to have led to higher values than the signal produced by the sun. This last point seems to be relevant again since at the moment only the rough measurements of the SORCE/TIM system point in the direction of an upward trend between the 2008 minimum and the 2017 minimum. Logically the explanation for this could be that the other satellite systems (which have been in use for a considerable number of years longer than the SORCE/TIM system) have become less sensitive.
This shows that the most experienced researchers from 2 of the 3 research teams that have been directly responsible for all facets of TSI satellite measurements since the start of satellite measurements since 1978 have openly distanced themselves from the PMOD methodology (+ implicitly also from the way in which the IPCC largely based its vision in AR5 on the PMOD methodology). Moreover, the National Solar Observatory also confirmed the assessment of the ACRIM research team with regard to the gap in the measurements24. Nevertheless, the PMOD methodology (in which the TSI minima show a continuous negative trend as a result of the use of proxies + a correction that cannot be justified in any way by the satellite data itself) has been adopted by the IPCC in AR5. Even though the overview presented by the IPCC itself - see figure 10 (= figure 8.10) - as well shows that all other reconstructions describe minima trends that are mainly directed upwards.  Moreover, a recent analysis based on data in the period 2010-2016 also shows that the PMOD shows a deviation that is approximately 2 to 3 times greater than deviation between all other instruments in the IPCC chart27 (the description below does show that the measurements of the SORCE/TIM are between the PMOD on the one side and the combination of the ACRIM and RIMB on the other side):
"For example, disagreement between the PMOD composite and SORCE TIM observations reaches values of 20%, increasing to 28% for the RMIB composite, and 31% for the ACRIM composite."
According the most experienced experts of the satellite systems involved in closing the gap in the measurements due to the Space Shuttle Challenger accident, the PMOD by no means is representative for the data measured in the satellite era. Scafetta & Wilson26 have very recently described that the PMOD only deserves the status of a 'model reconstruction' and not the status of a measurement series based on satellite measurements:
"Several TSI satellite composites have been proposed: ACRIM [26], PMOD [33,35], RMIB [36] and those suggested by Scafetta [37] and Dudok de Wit et al. [28]. Although these composites use different sets of TSI satellite records and merging methodologies, they are relatively equivalent since about 1992, the beginning of the ACRIM2 record, because they are all based on high-quality TSI observations. Yet, as clarified below, PMOD used their own modified versions of the original results compiled by the experiment teams for the SMM/ACRIM1, UARS/ACRIM2 and Nimbus7/ERB records to cover the period 1978-1992 and, therefore, its proposed record cannot be considered a real TSI satellite composite but a model construction. The ACRIM-PMOD controversy is about the scientific legitimacy of such modifications. ... Yet, the PMOD composite was favored by part of the scientific community [22,28] despite objections from the original TSI experiment teams who could find no experimental issues to justify the satellite data modifications proposed by Frohlich and Lean. See Willson and Mordvinov [26] and Hoyt's statement in Scafetta and Willson [38] that is partially reproduced in Appendix A."
Incidentally, in AR5, the IPCC, in turn, distanced itself from the findings of Scafetta. However, AR5 does not describe why the RIMB model is also being moved aside and basically is being ignored.
Figure 11 shows an illustration from the work of Richard Willson demonstrating, describing the difference between the ACRIM composite TSI (based entirely on satellite measurements; taking into account the 22-year magnetic cycle, one can also actually speak of a consistently upward trend in the minima) and the PMOD composite TSI (using corrections based on proxies for the period 1989-1991, with a consistent downward trend in minima based on the 22-year cycle)25.
Figure 11: ACRIM TSI model (with rising minima) vs PMOD TSI model (with falling minima) for the 1978-2013 period. An overview with both the PMOD, ACRIM and RIMB is available HERE + the source.
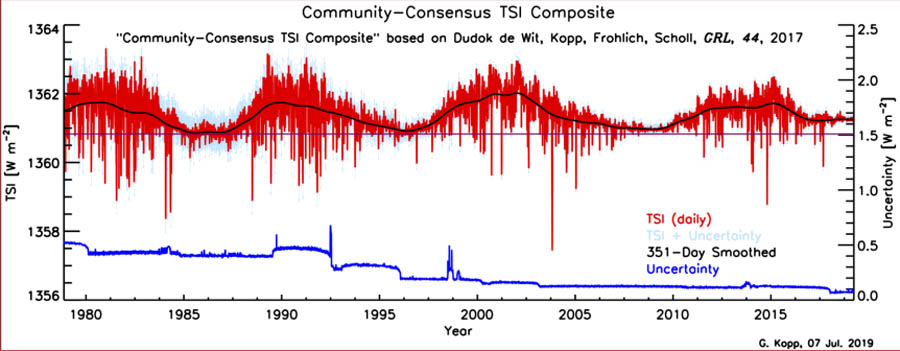
Finally, figure 12 shows for reference both the spectrum and the trend of the annual average for the LISIRD TSI which is central in this study 28 ; only the LISIRD and the RIMB (see figure 10 / figure 8.10) consistently shows an increasing trend for the minima throughout the satellite era: the 2017 minimum is higher than the 2008 minimum; the 2008 minimum is higher than the 1996 minimum; the 1996 is higher than the 1985 minimum.
Taking into account the 22-year magical cycle of the sun, a fundamental upward trend is also found at ACRIM at both the primary and secondary minima. Logically, this means that, based on the 22-year solar cycle, the PMOD is indeed not representative of the satellite era TSI - which confirms the vision of Scafetta, Willson & Hoyt. This pattern is also confirmed by the "unofficial" LISIRD TSI of SORCE / TIM principal investigator Greg Kopp in which the "Community Consensus TSI Composite" is incorporated (see figure 12 + figure 16 in the last paragraph).
Figure 12: LISIRD TSI spectrum + the trend in the annual TSI average for the period 1979-2019; an increasing trend is found at the minima throughout the satellite era; development of the uncertainty level is shown at the bottom.
VII - Solar minima show strong 'footprint' in the ENSO cycle: 80.8% of the 120 months are negative
In climate science, the ENSO cycle is held responsible for the largest year-on-year fluctuations in the global temperature20. In CMIP climate models and the IPCC view on climate, the influence of the sun and the ENSO cycle are being considered to represent 2 independent factors. The possibility that the sun is responsible for the fluctuations in the ENSO cycle is not taken into account.
The December 2019 article describes a section of the 'footprint' of the sun in the ENSO cycle. In line with the december article the present paragraph describes for the past 100 years that solar minima years mainly showed negative monthly ENS ONI values.
In paragraph V of the December 2019 article has already discussed two phenomena which show that the magnetic solar cycle has a strong impact on the ENSO cycle (after paragraph IV in the Augustus 2019 article summarizes details involving how the ENSO cycle serves as the controlling factor in the warming):
• The entire ENS ONI shows negative values in years in which the magnetic north pole starts with a change of polarity;
• The coincidence of TSI minima and the minima in the solar momentum (this relates to the movement of the sun around the barycenter) occurred in total only 5x during the downward phases of the multi-decades cycle and 1x during the 'gap' in global warming during the period 1998-2013.
Both the August 2019 article and the December 2019 article assume a delayed impact of the ENSO cycle on global temperatures; the extent of the delay was estimated at 6 months in August. This principle has also been applied in figure 13.
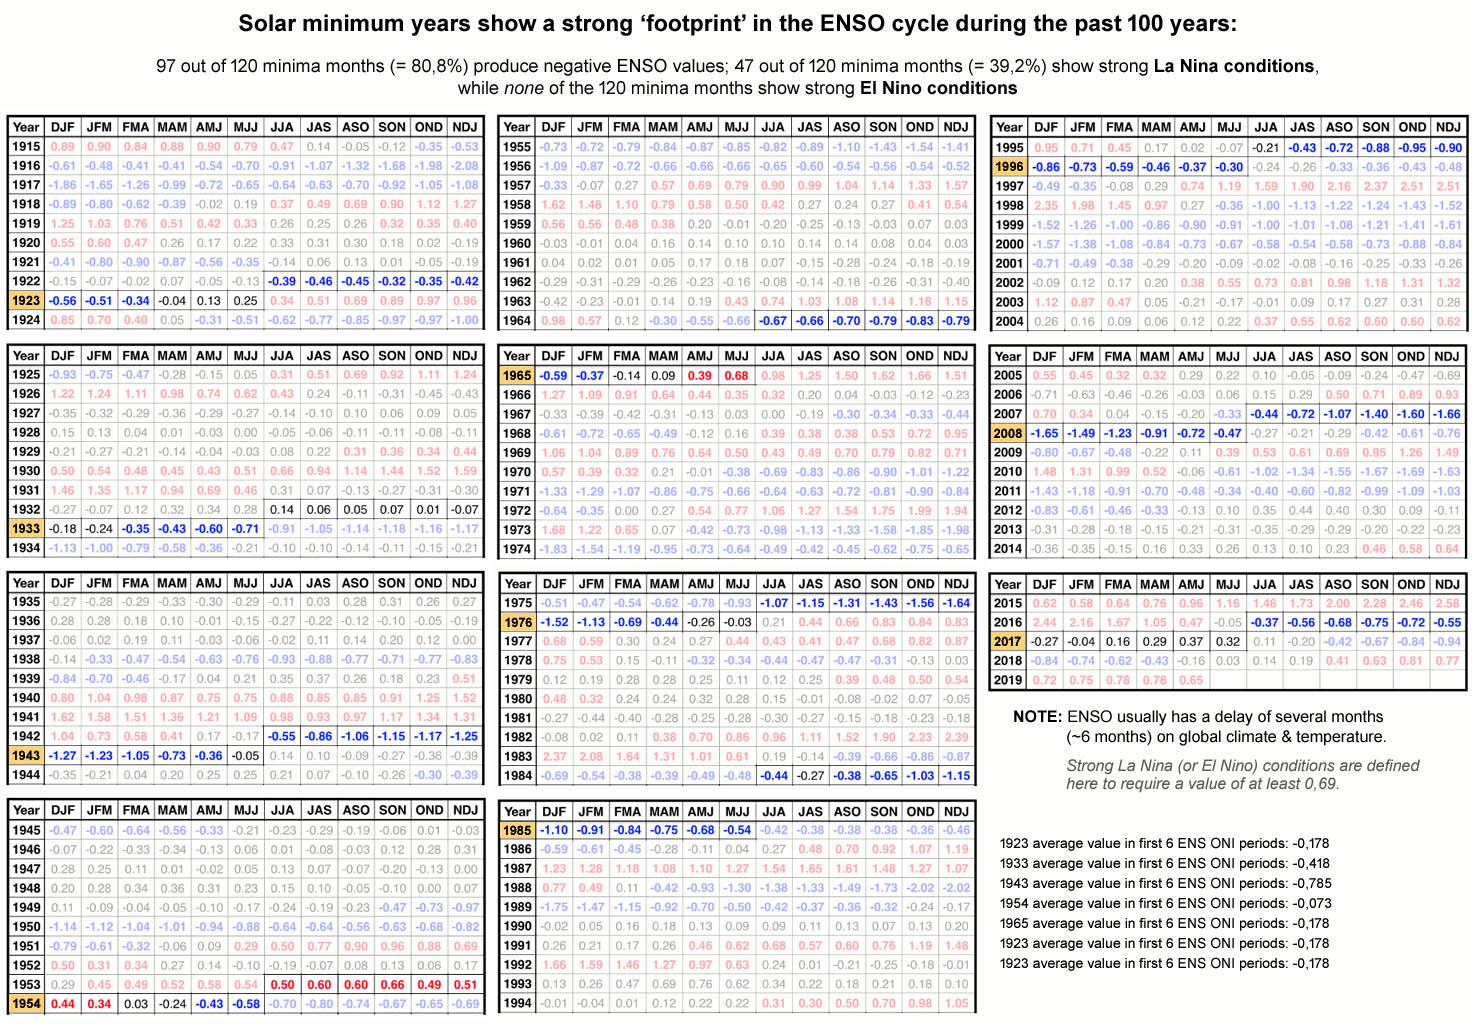
Figure 13: During the past 100 years solar minimum years show a strong 'footprint' in the El Nino cycle.
Figure 13 shows that the solar minima show a strong 'footprint' in the monthly values of the ENSO cycle: in no fewer than 97 of the 120 months involved (= 80.8%) a negative ENS ONI value is found. Moreover, for 47 of the 120 months (= 39.2%), the value shows a magnitude featured with the negative ENS ONI that was not found once in the minimum months with a positive ENS ONI. In total 25 of the 120 months (= 20.8%) exhibit strong La Nina circumstances, though this applies to just the 3-month average involved.
Striking is that with regard to the secondary minima a negative ENS ONI value is found in no less than 55 of the 60 monthly values (= 91.7%, the percentage for the primary minima is 70.0%). A negative ENSO value of at least -0.32 is observed in 51 of the 60 secondary minimum months (= 85%); for the primary minimum months, 32 of the 60 monthly values (= 53.3%) meet this criterion.
More erratic dynamics are found at the minima in the period prior to the year 1915.
The overall pattern suggests that the sun leaves it's 'footprint' in the ENSO cycle delay of a few months; however, it is likely that the extent of the delay may fluctuate a few months. This pattern fits in seamlessly with the descriptions in the previous sections, which show that the warming during 5 out of the past 6 magnetic cycles can largely be attributed to the sun. In the last paragraph it is discussed in the discussion among other things that Prof. Shaviv has described an amplifying factor with a value ranging from 5 to 7 for the impact of the solar cycle on temperature fluctuations in the ocean system (based on the solar minimum, a strengthening factor is found that varies from 6.1 to 7.4). The large impact of the sun on the ENSO cycle makes clear that the small fluctuations of the sun manifest via ENSO cycle; the ENSO cycle itself therefore also plays an important role in the creation of the amplification mechanism - in addition to the possible influence of UV, cosmic radiation & solar wind.
VIII - Discussion & conclusion
The Dutch KNAW's 2011 climate brochure describes the controversy involving the influence of the sun, to represent as one of the 7 most important 'controversies and uncertainties' that play a role in the outcome of climate models29. The KNAW assumes in its brochure that the role of the influence of the sun is "small". However, this assumption is contrary to the expertise of respected experts in the field of the sun. Scafetta, for example, claims that the sun is responsible for 60% of global warming since 1970 on the basis of a 60-year climate cycle30. Prof. Shaviv describes that about half to 2/3 of global warming in the 20th century can be attributed to the sun based on the influence of cosmic rays31.
In this study, the analysis focused on the 'primary minima' of the LISIRD TSI data set, shows that the HadSST3 seawater surface temperature (after correction for volcanism) has closely followed the solar activity during 5 of the 6 last magnetic solar cycles. Figure 6 describes that 59.2% of the warming in the period 1890-2017 can be attributed to the sun and for the most recent period 1996-2017 it even amounts to 97.6% of the warming. However, the period 1976-1996 provides solid ground to assume that anthropogenic influences should not be underestimated. However, the 'footprint' shows that global warming in the period 1976-1996 is mainly due to the aggressive CFCs (these are artificial greenhouse gases with an impact that can be 1000x stronger than is the case with CO2) and by no means to the much less aggressive natural greenhouse gases such as CO2.
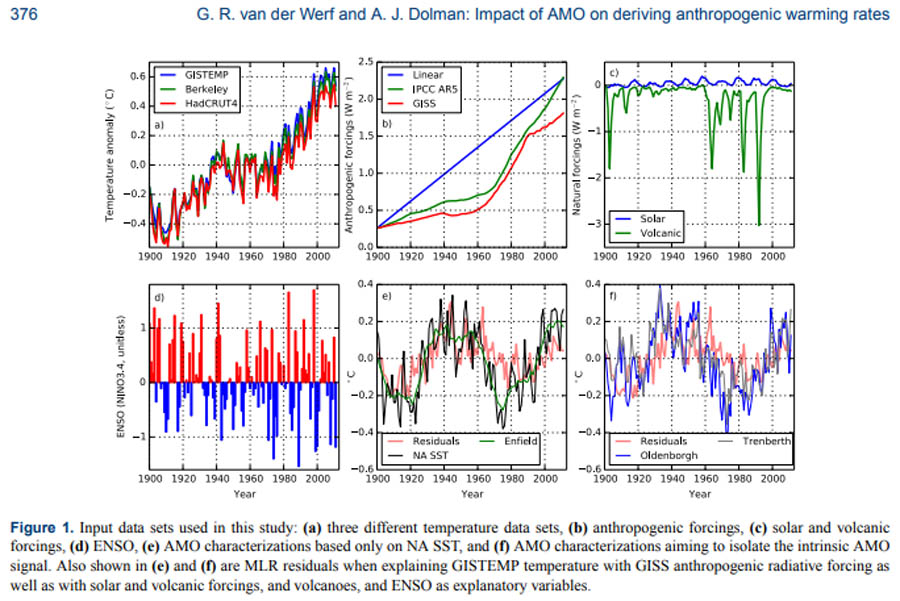 In climate models describing a high anthropogenic forcing, the fastest rising anthropogenic effect is found in the period 1970-1990. This is evident from, among other things, the AMO study (van der Werf & Dolman, 2014; figure 1b32) which is discussed in the appendix of the june 2019 article. In this AMO study some solar influence in the temperature rise between 1910-1940 is acknowledged (assumed is that it is combined with an anthropogenic effect), but the relationship of the warming with the ozone problem due to the CFCs is not noticed in the AMO study. The cause of the flattening of the growth rate of the anthropogenic effect from the end of the 1980s remains unexplained as well in the AMO study - the 'tippingpoint' approximately corresponds with the peak use of CFCs. The importance of solar minimums is also not recognized in the AMO study and the 22-year solar cycle is not mentioned. It is also interesting to notice that the authors speculate about an 'artifact' in the AMO study itself: the authors acknowledge that the AMO study underestimates the solar influence (which is based on the IPCC AR5 TSI data set from 2013).
Elsewhere in the scientific literature large dissension is found with regard to the warming up in the period 1910-1940. In a 2018 study, the warming in the period 1910-1940 is still being described as: "one of the most intriguing and less understood climate anomalies of the 20th century"33. This narrative hardly deviates from the narrative that had already arisen at the beginning of the 21st century among researchers at the Hadley Center for Climate Prediction Research, where natural influences for global warming in the period 1910-1940 are described as relatively more important.34. Other researchers describe that a combination of solar influence and lack of volcanism (combined with a relatively low level of aerosols35) represents the primary cause of the warming in this period36.
In a lecture from 1997 presented on the Dutch KNMI website, a description is also found concerning the dynamics of the influence of the sun in relation to CO2. Based on the sunspot cycle only, the author of the lecture assumes that "the slight cooling between 1940 and 1970" was created under the influence of the sun, however, it is assumed that this would have been limited thanks to the "compensatory rise in temperature due to greenhouse gases"37.
In the current study, the analysis is focused on the 'primary minima' of the LISIRD TSI shows that the temperature decrease of both the atmosphere (HadCRUT4) and the seawater surface (HadSST3) in the period 1943-1976 has been relatively greater than the decrease in the activity of the sun. This implies that the image sketched in the KNMI lecture based on sunspots is by no means tenable. For, on the basis of the minima the temperature rise (after correction for volcanism) of both the atmosphere and the seawater surface (figure 6) shows an almost 'perfect correlation' [for both applies: r> +0.9393; p=0.000] for the period 1890-1976 (see figure 1 & figure 6). For the period 1890-1976 a very high correlation is also found in the TSI series in the IPCC AR5 report (see figure 3: r = +0.94; p=0.008). This picture is by no means limited to the minima of the primary cycle; the minima of the secondary cycle show for the average TSI values of the LISIRD and IPCC AR5 for the period 1902-1965 and the seawater surface temperature (after correction for volcanism: AOD weight: 2 32) a similarly high correlation: r = +0.9996 [p=0.000]. For the TSI series separately, the correlations are respectively for the LISIRD: +0.9267 [p=0.039] and for the IPCC AR5: +0.9605 [p=0.020]. For the atmospheric temperature a comparable result is found as well based on the average of the LISIRD and IPCC AR5 at the secondary minima in the period 1902-1965: r = +0.9945 [p=0.000].
The magnitude of the temperature rise in the period 1890-1976 is for the HadCRUT4 +0.175°C and for the HadSST3 +0.243°C; in the NASA perspective of the GISSTEMP v4 the warming up during this period is +0.24°C and for the temperature of the ocean water it is an increase of +0.26°C. The average global warming for the period 1890-1976 is therefore approximately +0.21°C and +0.25°C for the sea water surface temperature. After correction for volcanism (see figure 14: the AOD value is slightly higher for the year 1890 than for the year 1976, the difference is: 0.011), the warming between 1890 and 1976 comes to approximately +0.2°C. Based on the described perfect correlations for both the 'primary minima' and the 'secondary minima', it is concluded that the +0.2°C warming in the period 1890-1976 can be fully understood as the result of the upwardly directed oscillating increase in the sun activity.
Figure 14: Stratospheric aerosols optical depth (AOD) according NASA.

From the overall picture it is concluded here that in the perspective of the solar minima prior to 1976 there is no room for any significant influence of CO2 on the temperature; the impact of the corrections used for volcanism is limited in this perspective. This conclusion is supported by the analysis in the December 2019 article. By the way, when other data sets are used for temperature (such as the GISSTEMP v4) and the TSI (such as the NRLTSI2 en Satire), comparable results are found for the period 1890-1976, both with and without AOD correction for volcanism. The biggest differences when using other data set combinations are mainly found in the 2nd half of the 19th and the period after 1976.
Based on the various 'perfect correlations' (for the period 1890-2017 with regard to the sea water, for the period 1890-1996 with regard to the atmosphere) it is concluded that all doubts are unfounded with regard to the existence of an amplification mechanism within earth's climate system. The amplifying factor makes it possible that the relatively small fluctuations at the solar minima have induced the 66-year cycle plus the upward directed long-term temperature trend. Regarding the size of the amplification factor: based on the solar minima relative to the temperature impact of the 11-year solar cycle (~0.18°C38) values are found ranging from more than 6 at the primary minima (6,1 based on the scale ratios in Figure 6) up to more than 7 at the secondary minima (7.4 based on the scale ratios at the perfect correlation described for the perspective of the secondary minima based on the average TSI values of the LISIRD and IPCC AR5). These values are only slightly higher than the bandwidth of 5-7 for the amplification factor that Prof. Shaviv is described for fluctuations in the ocean system39. In this comparison with regard to the temperature impact of the 11-year solar cycle, it is not necessary to take into account for Earth's Albedo (30%), nor the factor concerning the shape of the earth, as a result of which only a net of 1/4 of the grid the solar radiation reaches the earth's surface per square meter.
The following is relevant as well: Svensmark recently (2019) described slightly lower values for the enhancing factor involving the perspective of the radiation forcing: (1) in the 11-year solar cycle, an enhancing factor with a value of about 3 is found in the surface water temperature of the sea water; (2) in relation to sea level fluctuations, a gain is described with a bandwidth ranging approximately from 3.5 to 540.
Another important element in the creation of the amplification mechanism is the role of the ENSO cycle, which is in the view of the IPCC completely disconnected from the sun. Nevertheless, there is speculation in the scientific literature about the influence of the sun on the ENSO cycle41; a.o. is described that the peak years of the solar cycle regularly coincide with the negative phase of the ENSO cycle 42. In the December 2019 article paragraph V has been demonstrated that the magnetic north pole has a strong influence on the ENSO values; in the present article is shown in paragraph VII that this influence has also been clearly visible over the past 100 years at the level of the monthly values at the solar minima. The ENSO cycle is therefore a factor that is also important in the creation of the amplification mechanism, in addition to a possible role for: UV, cosmic radiation & solar wind.
The December 2019 analysis describes that the sunspot cycle causes 'climate noise'. The sun is described herein as a complex of cycles, wherein the poloïdal magnetic field is half a phase ahead of the sunspot cycle and the TSI. This relates to the fact that the magnetic forces play a role in the creation of sunspots, occur about 5 to 7 years earlier in the core of the sun and then remain for years in the convection zone before they manifest on the surface of the sun43. This phenomenon can partly explain why the December 2019 analysis described a phase difference which gives the impression that the solar cycle is lagging behind the temperature development on earth. This phenomenon is probably also related to the opposite saw-tooth movement described between the primary and secondary minima in section I. The current analysis shows that after the primary and secondary minima have been disconnected, the impact of this is very limited (approximately nil) for the minima.
The exact influence of these processes is not easy to describe; however, the phenomenon provides insight into how the 'climate noise' between solar activity and temperature arises through the manifestation of sunspots. From this perspective, it is significant that the IPCC largely bases its main conclusions on the influence of the sunspot cycle only. The current research shows that it is precisely the fluctuations of the sunspots that are not suitable for this - this is furthermore directly apparent from the fact that the IPCC has recognized that the minima in the solar cycle are both a more stable factor and also a more relevant factor for the long-term trend than with the maxima
The green curve in figure 15 shows (combined with the data in figure 13) that the two super El Ninos from '82/'83 and '97/'98 manifested precisely at the last 2 peak moments in the cycle of the momentum of the sun's movement around the barycenter. This is another indication that the sun is directly involved in the formation of the most extreme positive phase of the ENSO cycle, formed by the super El Ninos. Here it must be noted that the 3rd super El Nino from 2015/2016 presented itself just after the last bottom phase of the momentum. This shows that an important part of the relationship with the highest values of the ENSO cycle is found via the extremes in the perspective of the solar momentum (earlier has been described that the extremes of the monthly TSI show a strong connection with the underside of the ENSO cycle, after two similar phenomena have been described in paragraph V of the December article). The net warming in the period 1890-1996 amounts to approximately +0,6°C.
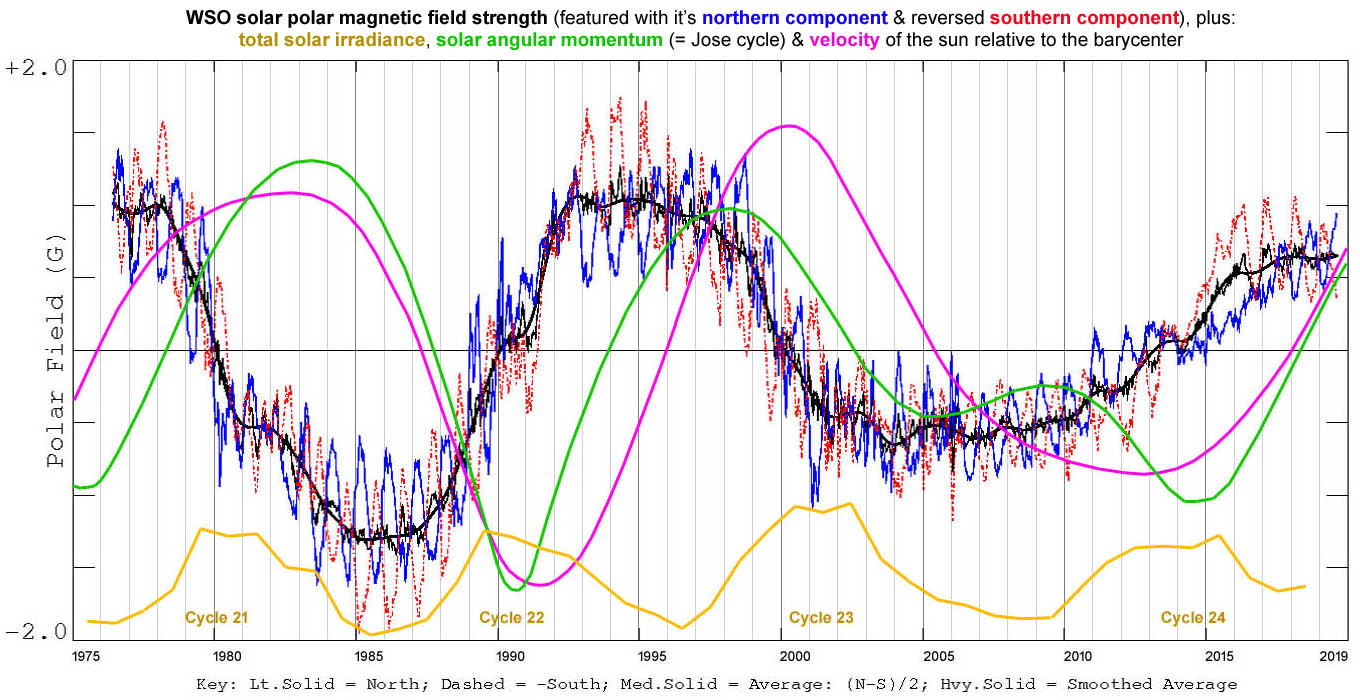
Figure 15: Development of the sun's magnetic field power (WSO44), plus: total solar irradiance (LISIRD3), solar momentum (Jose cycle - McCracken)45 & solar speed (Scafetta, figure 7a46) resulting from the movement of the sun around the bary center.
The descriptions above show that the sun can also be considered via the El Nino cycle as the main driving force behind climate and weather related phenomena.
The impact of the solar cycle is also reflected in the fact that the last 6 Elfstedentochten in the period after 1950 took place during the bottom phase of the TSI or the sunspot cycle. The relation is considerably weaker in the period 1900-1950, but this is also reflected in a weaker relation between the solar cycle and the temperature. In the period 1850-1900 there is often even an inverse relationship between the solar cycle and the temperature, so the relationship between the two in the distant past did not have the seemingly 'logical' dynamics that have mainly become visible since 1950. An analysis that goes further back in time than 1850 should take into account the incomplete solar cycles; an example of this phenomenon occurred, for example, around 191047.
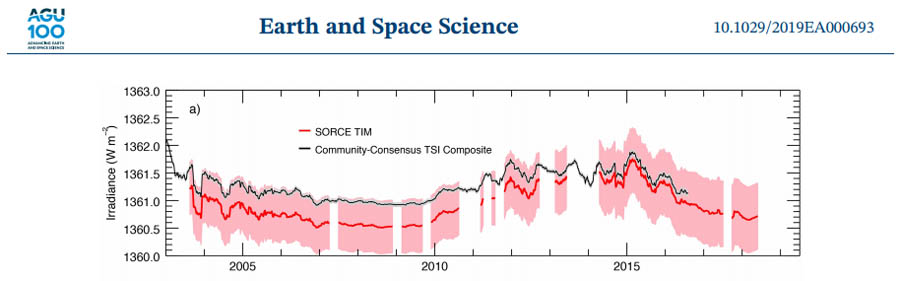
Figure 16: The Community Consensus TSI Composite vs SORCE/TIM TSI (2003-2018).
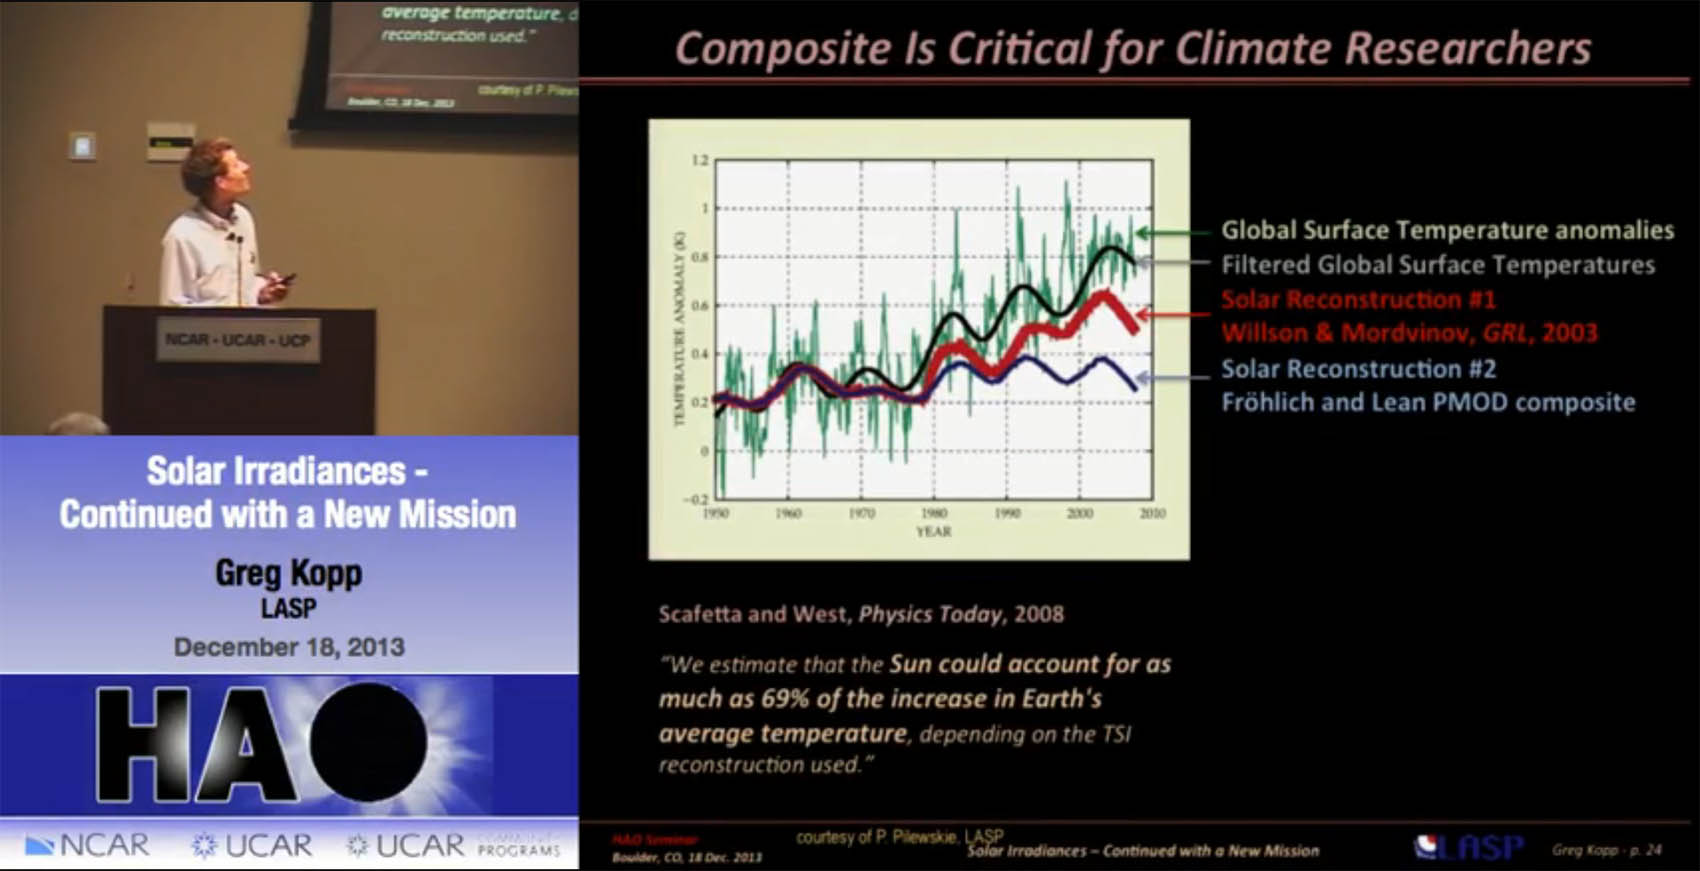
The LISIRD TSI data set that is central to the present research is based, among other things, on the Community Consensus TSI Composite 48. LISIRD author Greg Kopp is principal investigator of the SORCE satellite project, which delivered the new consensus standard for the basic level of the sun in 2008 was realized. The data set of this researcher for the period of the satellite era is based entirely on satellite measurements (without the use of proxies, such as is the case for the PMOD). On YouTube there are a few presentations by this researcher in which he himself describes the alleged 'consensus' which presumes that climate change over the past 150 years is the result of anthropogenic factors (see Kopp's 2011 presentation), however, Kopp also confirms that the TSI model choice has a major impact on the extent of the sun's contribution to global warming (see Kopp's 2013 presentation + figure 17). That is why it is important that a common TSI model for the satellite era is now available: the Community Consensus TSI Composite (see Kopp's 2017 presentation), which is used in the LISIRD - this explains why the "unofficial" data series from Kopp does not show the strong downward trend that is visible at the minima in the PMOD data set (+ the SATIRE model). Although the LISIRD is not an "official" TSI, it does, in Kopp's view, contain the best values available to the experts. Kopp explained the current state of affairs regarding the Community Consensus TSI Composite during ISSI Sunspot Team Meeting #2 (august 19-23, 2019); The presentation also contains a detailed description of the data sets that compose the LISIRD. Since no scientific descriptions are found in the scientific literature that come close to a 'perfect correlation' between the temperature and the activity of the sun, Kopp probably does not realize that the minima in his own TSI data set do suggest that the influence of the sun (with the 22-year cycle taken into account) on the temperature (with the influence of volcanism taken into account) is much stronger than he presumes.
Figure 17: LISIRD author Greg Kopp describes the controversy among TSI experts about the influence of the sun on climate change.
The LISIRD describes, like the NRLTSI2 and Satire that the TSI rose between the Maunder minimum and the recent minimum 2017/2018 with 1 W/m2, which corresponds to the descriptions of Zharkova et al.50, who describe of an interim increase in the solar cycle average of 1-1,5 W/m2 that closely correlates with the rise in the basic level of the earth's temperature. Zharkova describes a temperature trend of + 0.5C per 100 years that is attributed to natural causes. However, Zharkova also does describe that it is not yet clear whether the temperature rise on earth can be entirely attributed to the sun or possibly to some other factors that relate on the one hand to the interaction between sun and earth and on the other hand as a result of human activities50. The present study, based on solar minima, describes that human activities have clearly had an impact through the use of CFCs in particular - which has resulted in the problem of the ozone layer in the South Pole in particular (even though the so-called season-related 'hole in the ozone layer' has been in a recovering state since the beginning of the 21st century).
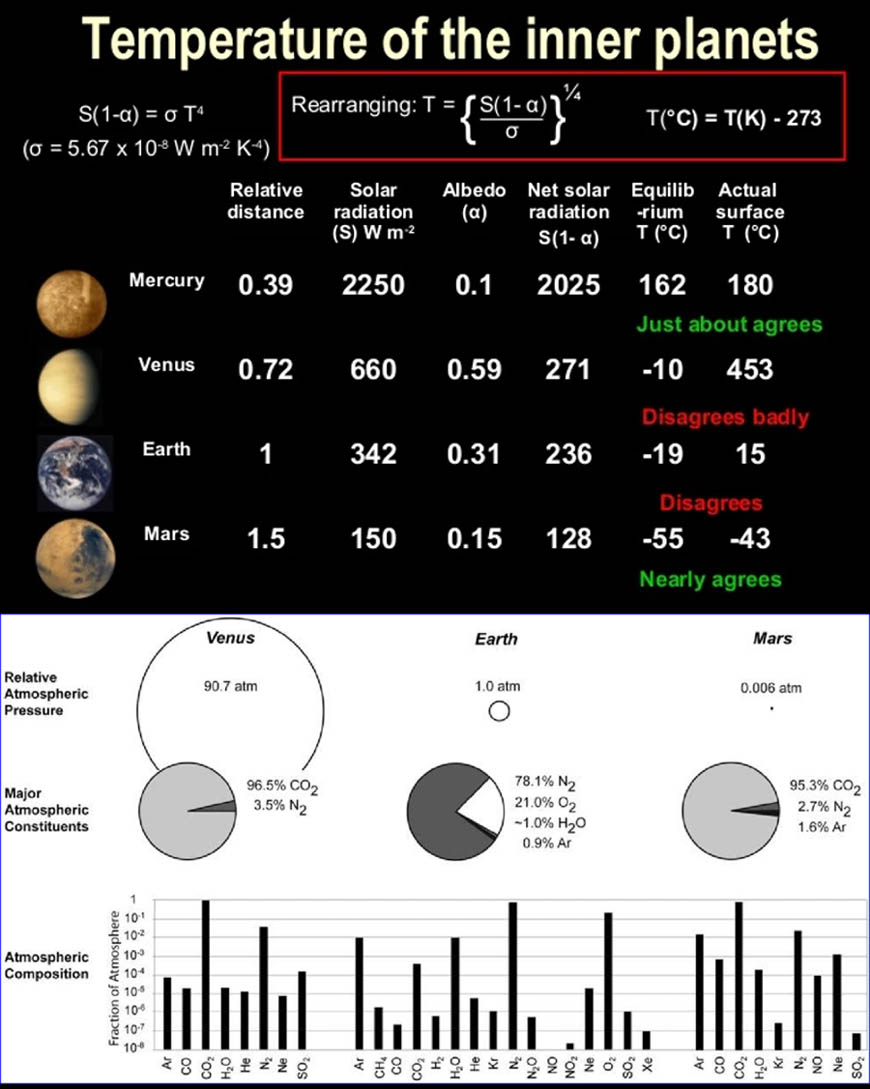
Regarding the role of CO2, there is more uncertainty than the "consensus" (which is supported and described by the IPCC) suggests. In addition to the fact that the temperature impact of CO2 within the climate system cannot be demonstrated with empirical evidence taken directly from the climate system, comparisons are also available between the earth (CO2 concentration of the atmosphere: 0.04% at a temperature of on average 15°C at a pressure of 1 bar, resulting in a greenhouse effect of 33°C) with planets with a much higher CO2 concentration, such as: Venus (CO2 concentration atmosphere: 96.5% at an average temperature of 480°C at a pressure of 93 bar, resulting in a greenhouse effect of 500°C) and Mars (CO2 concentration atmosphere: 95.2% at a temperature of -63°C on average at a pressure of 0.085 bar, resulting in a greenhouse effect of 5.5°C). Incidentally, this means that the amount of CO2 on Venus is almost 11,000x higher than on Mars and no less than 280,000x higher than on Earth. This comparison shows that despite extremely high CO2 concentrations, the average climate sensitivity for an increase of 300 ppm is limited to only 0.0017°C on Venus and + 0.19°C on Mars respectively; for the situation on earth around 1920, the value is estimated at 0.4°C51,52,53. This climate sensitivity estimate of 0.4°C is within the estimate of a maximum of 0.49°C that is described in the December 2019 article. Figure 18 describes the impact of the greenhouse effect on the Mars & Venus (+ Mercury) planets alongside the Earth; André Bijkerk describes HERE several critical comments regarding the perceptions involved with the greenhouse effect, which formally still has the status of a theory only.
Figure 18: Fundamental climate factors for the inner planets of Earth, Mars & Venus (+ Mercury) - source illustration. Especially for Venus and the earth a relatively strong warming is visible that arises from the 'greenhouse effect' in the atmosphere.
Based on an analysis of the minimum years in different TSI data sets, an overall picture has been described which shows that the temperature (after correction for volcanism) shows a strong correlation with the course of the sun's activity. Based on the primary minima in the LISIRD TSI data set, only the temperature rise in the period 1976-1996 cannot be explained by the sun. The 'perfect correlations' described at both primary and secondary minima also show that: 1) there is no room for doubt about the existence of a reinforcing mechanism for the influence of the sun in the period 1890-1976; 2) the ENSO cycle is largely determined by the activity of the sun; 3) only in the period after 1950 do the minima and maxima show a 'logical' relationship with temperature, between 1900 and 1950 the relationship is missing, between 1850 and 1900 there is an opposite 'non-logical' relationship. In the analysis of December 2019 a phase difference is described for both the perspective of the 'minima' and the 'background solar irradiance'. In the current study, after splitting the 'primary minima' and the 'secondary minima' it has become clear that the phase difference does not apply to the minima; this has directly become apparent from the perfect correlations that are described separately for both the primary and secondary minima. Also, the phase difference is directly related to the sunspot cycle itself - which lags a half phase because sunspots arise from magnetic phenomena that remain within the convection zone for 5 to 7 years before they manifest on the surface outside the convection zone.
The conclusion is that between 1890 and 2017, the warming of the seawater surface area (+0.9°C) was caused for 2/3 by the sun and for 1/3 by the use of CFCs (especially in the period 1976-1996). The strong correlation between CO2 and temperature is therefore based on a spurious relationship that can be explained by the combination of the increased solar activity combined with a temporary impact of CFCs. The +0.13°C additional warming in the atmosphere that originated from the continents between 1996 and 2017, can largely be attributed to a mix of anthropogenic factors - both the growth of the world population and the higher air quality in Europe & many other Western countries represent major impact factors. This has resulted in, among other things, large-scale production of greenhouse gases (including CO2) + changes in land use. The production of aerosols may have concealed the impact of anthropogenic influence, especially in Asian countries, but in the Western world (especially in Europe), cleaner air has in recent decades contributed to relatively high, often local, warming. Because after correction for volcanism and the ozone problem the warming of the ocean water surface can be attributed fully to the increased activity of the sun, the 'footprint' of CO2 is empirically missing.
In summary, the global warming ratios are as follows: the ~0.2°C warming in the period 1890-1976 is attributed to natural factors, with the sun as the driving force. Subsequently, in the period 1976-1996, anthropogenic warming of ~0.4°C arose in addition to the ozone problem. Finally, in the period 1996-2017 a warming of ~0.5°C has arisen which can largely be attributed to the sun (~0.37°C); in addition, a small unexplained part (~0.13°C) remains that originated on the continents and is therefore probably of an anthropogenic nature.
This means that more than ~0.53 C (48%) of the ~1.1°C warming that occurred between 1890 and 2017 can be attributed to anthropogenic activities, ~0.57°C (52%) to the sun. For the entire period between 1976 and 2017, the ratios are reversed with an anthropogenic share of ~0.53°C (59%) compared to only ~0.37°C (41%) for the share of the sun; however, in the period 1996-2017, global warming can largely be attributed to the sun in the form of ~0.37°C (74%) compared to only ~0.13°C (26%) anthropogenic warming.
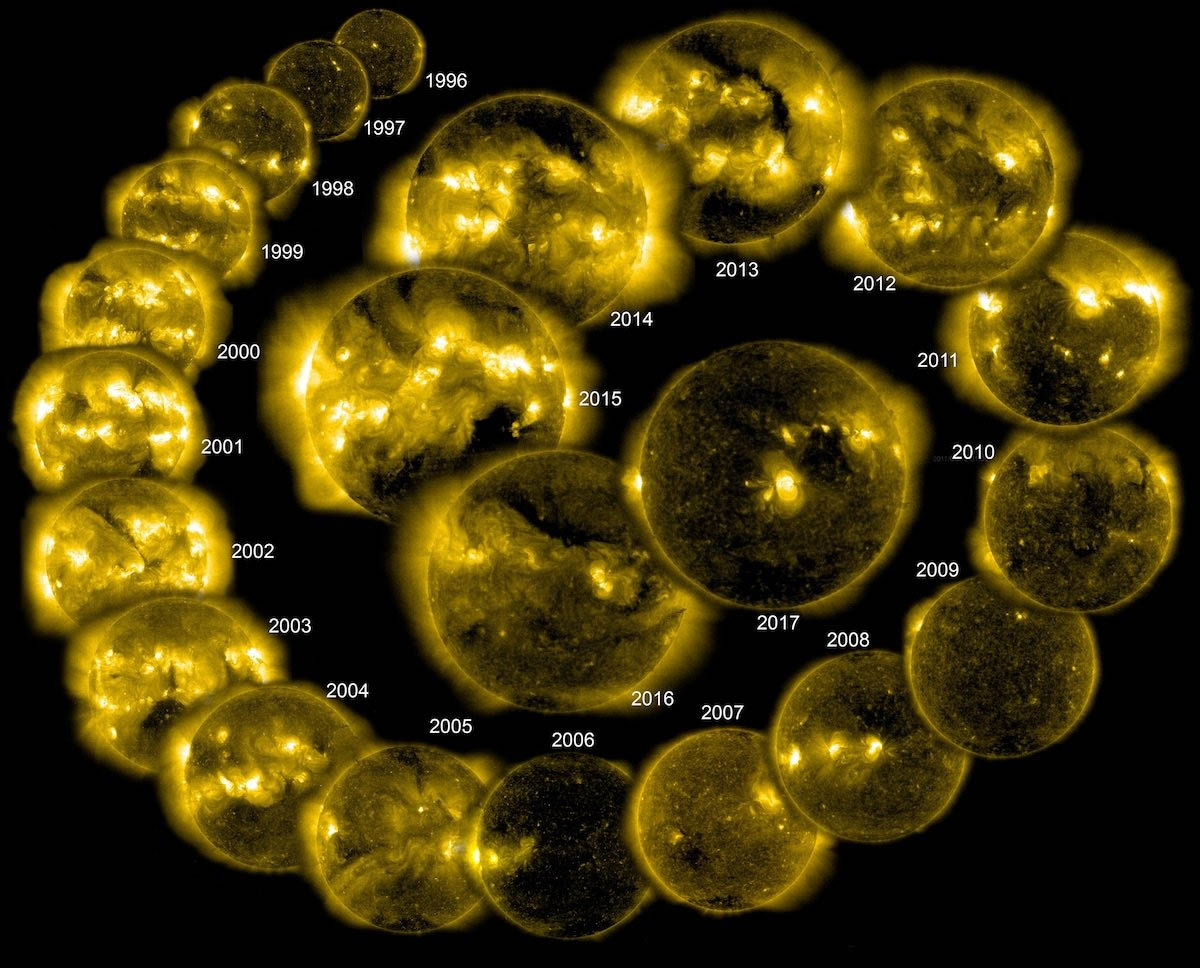
Figure A: In 2017, on the occasion of the 22-year existence of the SOHO space telescope observing the sun, the illustration below was presented, which describes the last complete 22-year magnetic solar cycle. The SOHO is a project of ESA and NASA. (SOHO = Solar and Heliospheric Observatory)
VIDEO: NASA describes the solar cycle.
The solar cycle is accompanied by a cosmic movement of the sun around the barycenter;
the appendix of the december article describes the mechanism by detail.

References:
1 - IPCC, 2013: Climate Change 2013: The Physical Science Basis. Contribution of Working Group I to the Fifth Assessment Report of the Intergovernmental Panel on Climate Change
- page 1462: "Solar activity General term describing a variety of magnetic phenomena on the Sun such as sunspots, faculae (bright areas), and flares (emission of high-energy particles)."
2 - The Global Solar Dynamo - R.H. Cameron (february 2016).
3 - Met Office Hadley Centre observations datasets: HadCRUT4 Data: download [global (NH+SH)/2] (2019)
4 - Met Office Hadley Centre observations datasets: HadSST3.1.1.0 Data [annual globe] (2019).
5 - LASP LISIRD - Historical Total Solar Irradiance Reconstruction, Time Series (2018); author: Greg Kopp is the lead researcher of the LASP SORCE/TIM project (biography).
6 - IPCC AR5 2013, 8SM: Anthropogenic and Natural
Radiative Forcing - Supplementary Material (2013) 8.SM.4 Total Solar Irradiance Reconstructions from 1750 to 2012 to Support Section 8.4.1 - Table 8.SM.3 | Total Solar Irradiance (TSI, W m-2) reconstruction since 1750 based on Ball et al. (2012) and Krivova et al.(2010) (annual resolution series). The series are standardized to the Physikalisch-Meteorologisches Observatorium Davos (PMOD) measurements of solar cycle 23 (1996-2008) (PMOD is already standardized to Total Irradiance Monitor (TIM)).
7 - NASA: Stratospheric Aerosol Optical Thickness (2019)
8 - Expert Review Comments on the IPCC WGI AR5 First Order Draft -- Chapter 8 (2013) - comment 8-745.
9 - IPCC, 2013: Climate Change 2013: The Physical Science Basis - 8 Anthropogenic and Natural Radiative Forcing
- page 689 (chapter 8): "The year 1750, which is used as the preindustrial reference for estimating RF, corresponds to a maximum of the 11-year SC. Trend analysis are usually performed over the minima of the solar cycles that are more stable. ... Maxima to maxima RF give a higher estimate than minima to minima RF, but the latter is more relevant for changes in solar activity."
10 - The GnevyshevOhl Rule and Its Violations - N.V. Zolotova (february 2015).
11 - 2018 Continues Record Global Ocean Warming - L. Cheng et al. (maart 2019) - Quote: "The vast majority of global warming heat ends up deposited in the world's oceans, and ocean heat content (OHC) change is one of the best - if not the best - metric for climate change (Cheng et al., 2019)".
12 - WMO: Key Climate Change Indicators from the Ocean (2017 update).
13 - Copernicus (EU): 'INSIGHTS INTO THE ROLE OF THE OCEANS IN THE EARTH ENERGY BUDGET' - K. von Schuckman (november 2017) - Quote sheet 10: "The Earth energy imbalance can best be estimated from changes in ocean heat content, complemented by radiation measurements from space (von Schuckmann et al., 2016, NCC)".
14 - KNMI: Wereldgemiddelde temperatuur en CO2 nemen verder toe - G.-J. Oldenborgh (november 2018).
15 - The unstable CO2 feedback cycle on ocean planets - D. Kitzmann et al. (august 2015).
16 - Greenhouse gas growth rates - J. Hansen & M. Sato (september 2004); source describes 14% for the period 1850-2003, adjusted to 1850-2018 the percentage raises to 15%.
17 - Seasonal and Diurnal CO2 Patterns at Diekirch, LU 2003 - 2005 - F. Massen et al. (march 2007); section 4.1 & 4.3.
18 - Breakpoint lead-lag analysis of the last deglacial climate change and
atmospheric CO2 concentration on global and hemispheric scales, LU 2003 - 2005 - Zhi Liu et al. (may 2018).
19 - Climate Change 2014: Synthesis Report - Summary for Policymakers (2014) - Quote (page 5): "The evidence for human influence on the climate system has grown since the IPCC Fourth Assessment Report (AR4). It is extremely likely that more than half of the observed increase in global average surface temperature from 1951 to 2010 was caused by the anthropogenic increase in GHG concentrations and other anthropogenic forcings together. The best estimate of the human-induced contribution to warming is similar to the observed warming over this period (Figure SPM.3)."
20 - IPCC Assessment Report 5 - CLIMATE CHANGE 2013
The Physical Science Basis (2013) - Quote page 17: "It is extremely likely that more than half of the observed increase in global average surface temperature from 1951 to 2010 was caused by the anthropogenic increase in greenhouse gas concentrations and other anthropogenic forcings together. The best estimate of the human-induced contribution to warming is similar to the observed warming over this period."
21 - Cosmic-Ray-Driven Reaction and Greenhouse Effect of Halogenated Molecules: Culprits for Atmospheric Ozone Depletion and Global Climate Change - Q.-B. Lu (may 2013).
22 - Substantial twentieth-century Arctic warming caused by ozone-depleting substances - L.-M. Polvani et al. (january 2020).
23 - Greg Kopp's TSI page (january 2020) - Greg Kopp is the lead research of the LASP SORCE/TIM project (biography).
24 - Astronomy and the Climate Crisis - A. Cooke (january 2012); pagina 116-119.
25 - ACRIM3 and the Total Solar Irradiance database - R.C. Willson (february 2014).
26 - Modeling Quiet Solar Luminosity Variability from TSI Satellite Measurements and Proxy Models during 1980-2018 - N. Scafetta, et al. (november 2019).
27 - Solar Irradiance Variability: Comparisons of Models and Measurements - O. Coddington, et al. (november 2019).
28 - An Historical TSI Reconstruction Based on Reevaluations of the TSI Composite and Sunspot Records - G. Kopp, et al. (august 2019).
29 - Klimaat brochure 'Klimaatverandering, Wetenschap en Debat' - Koninklijke Nederlandse Academie van Wetenschappen (2011).
30 - Climate Change Attribution: Using Empirical Decomposition of Climatic Data - C. Loehle & N. Scafetta
(2011).
31 - GWPF: Nir Shaviv - The Cosmic Ray Climate Link (april 2018).
32 - Impact of the Atlantic Multidecadal Oscillation (AMO) onderiving anthropogenic warming rates from the instrumental temperature record - G.R. van der Werf & A.J. Dolman
(2014).
33 - Contributions of Natural and Anthropogenic Forcing Agents to the Early 20th Century Warming - T. Egorova et al. (2018).
34 - External Control of 20th Century Temperature by Natural and Anthropogenic Forcings - P.A. Stott et al. (december 2000).
35 - An 800-year high-resolution black carbon ice core record from Lomonosovfonna, Svalbard - D. Osmont et al. (september 2018).
36 - Solar and Greenhouse Gas Forcing and Climate Response in the Twentieth Century - G.A. Meehl et al. (february 2003).
37 - KNMI: Invloed variaties in zonneactiviteit op het klimaat op aarde - G. Hirs (1997, Nov 14). Zon en klimaat; invloed variatie zonne-energie op het klimaat. Den Haag.
38 - Surface warming by the solar cycle as revealed by the composite mean difference projection - C.D. Camp & K. Kit Tung (july 2007).
39 - Using the oceans as a calorimeter to quantify the solar
radiative forcing
- N. Shaviv (2008).
40 - FORCE MAJEURE
The Sun's Role in Climate Change - H. Svensmark (2019).
41 - Possible solar modulation of the ENSO cycle - K. Kodera (2005).
42 - Solar cycle signals in sea level pressure and sea surface temperature - I. Roy & J.D. Haigh (2010).
43 - Differential rotation and the solar dynamo - M. Stix (1976).
44 - Wilcox Solar Observatory Polar Field Observations (december 2019).
45 - Evidence for Planetary Forcing of the Cosmic Ray Intensity and Solar Activity Throughout the Past 9400 Years - K.G. McCracken, et al. (march 2014).
46 - Solar and planetary oscillation control on climate
change: hind-cast, forecast and a comparison with the CMIP5 GCMs - N. Scafetta (july 2013).
47 - The solar magnetic field since 1700. II. Physical reconstruction of total, polar and open flux - J. Jiang et al. (2018); see figure 4b/5b.
48 - Solar Irradiance Variability: Comparisons of Models
and Measurements - O. Coddington et al. (december 2019); figure 6a.
49 - Observational determination of surface radiative forcing by CO2 from 2000 to 2010 - D.R. Feldman, et al. (2015).
CLIMATE INDEX:
•
Millennium analysis: climate sensitivity CO2 is below IPCC bandwidth
•
IPCC dataset sun explains half of warming since 1815
•
Impact sun on climate is underestimated significantly
•
Since 17th century: +1,1 °C by sun
• 1890-1976: Sun shows perfection correlation with temperature
• Side-role for CO2: solar activity explains warming since 1976
• Impact of CO2 on climate overestimated (substantially) due to 66-year cycle & El Nino
What do proxy climate indicators show?
• 2° Institute proxies: temperature rose in the past multiple decennia in a row even faster
• PAGES 2k Network illustration (2013)
• PAGES 2k Network illustration: 2019 hockeystick graphic vs 2013 temperature data
ClimateCycle articles in Dutch language:
•
IPCC dataset zon verklaart met vulkanisme helft opwarming sinds 1815
•
Tussen 1685 en 1976 volgde de temperatuur de totale zonnestraling
• Boekrecensie: SOLAR MAGNETIC VARIABILITY AND CLIMATE
•
Online seminar door zonnefysicus Dr. Greg Kopp: 'Zonnestraling & klimaat'
•
Impact zon op klimaat fors onderschat
•
Sinds 17de eeuw: +1,1 °C door zon
•
SAMENVATTING: Hoe ontstaat de Klimaatcyclus en wat is haar impact?
• 1890-1976: Zon toont perfecte correlatie met temperatuur
• Zon verklaart opwarming sinds 1976
• El Nino & 66-jarige cyclus: CO2 overschat
• 70-Jarige cyclus: opwarming overschat
• Global warming vs fluctuaties in 2 dagen
• Oceaan: diepzee koelt af
• KlimaatCyclus.nl